🛰 STONKUSDT IS PULLING BACK INTO A STRUCTURAL ZONE
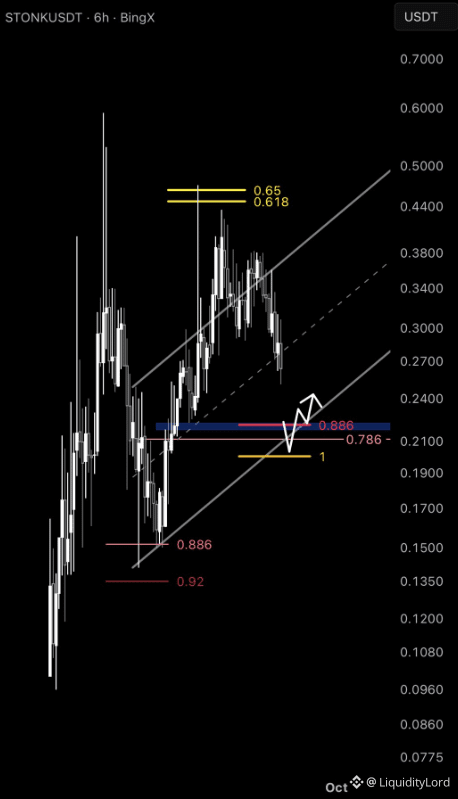
STONK/USDT on the 6H chart is near 0.27 after rejection from the 0.34–0.38 area. The rising channel remains, but price is approaching the lower boundary where buyers previously reacted.
🧭 THE RETEST MATTERS
The marked 0.21–0.22 region is the main area to watch. It combines channel support with a previously tested horizontal zone. A strong reaction there keeps the structure relevant.
A deeper move below the channel could expose the lower levels around 0.15 and 0.135.
📐 FIBONACCI MAP
The chart marks 0.786 around 0.21, with 0.886 and 1.0 positioned lower. This creates a retracement ladder rather than one support.
The important signal is the reaction at the channel. A wick into support followed by a reclaim would differ from a clean breakdown with follow-through.
🎯 TRADE PLAN
Entry: 0.215–0.235
Invalidation: 0.195
TP1: 0.270
TP2: 0.340
TP3: 0.440
The setup depends on a reaction from demand rather than chasing the current candle. If 0.195 fails decisively, the structure should be reassessed.
🔬 LEVELS AHEAD
The upper chart contains the 0.44–0.46 Fibonacci resistance cluster. Reaching it would require STONK to reclaim the mid-channel and then recover the recent swing area near 0.34–0.38.
That creates several checkpoints. The reaction around 0.21–0.22 is therefore more important than short-term noise inside the range.
⚙ A FRESH ST0Nfi DETAIL
ST0Nfi can be integrated into other products through its SDK, API and embeddable swap widget. Its documentation also describes referral mechanics connected with referral links or an embedded Omniston widget, giving developers a way to route swaps from their own interfaces.
For STONK, the map is straightforward: defend the channel, reclaim resistance, then challenge the upper Fibonacci cluster. A breakdown below the marked base would invalidate that sequence.
NFA - DYOR!
STONK/USDT on the 6H chart is near 0.27 after rejection from the 0.34–0.38 area. The rising channel remains, but price is approaching the lower boundary where buyers previously reacted.
🧭 THE RETEST MATTERS
The marked 0.21–0.22 region is the main area to watch. It combines channel support with a previously tested horizontal zone. A strong reaction there keeps the structure relevant.
A deeper move below the channel could expose the lower levels around 0.15 and 0.135.
📐 FIBONACCI MAP
The chart marks 0.786 around 0.21, with 0.886 and 1.0 positioned lower. This creates a retracement ladder rather than one support.
The important signal is the reaction at the channel. A wick into support followed by a reclaim would differ from a clean breakdown with follow-through.
🎯 TRADE PLAN
Entry: 0.215–0.235
Invalidation: 0.195
TP1: 0.270
TP2: 0.340
TP3: 0.440
The setup depends on a reaction from demand rather than chasing the current candle. If 0.195 fails decisively, the structure should be reassessed.
🔬 LEVELS AHEAD
The upper chart contains the 0.44–0.46 Fibonacci resistance cluster. Reaching it would require STONK to reclaim the mid-channel and then recover the recent swing area near 0.34–0.38.
That creates several checkpoints. The reaction around 0.21–0.22 is therefore more important than short-term noise inside the range.
⚙ A FRESH ST0Nfi DETAIL
ST0Nfi can be integrated into other products through its SDK, API and embeddable swap widget. Its documentation also describes referral mechanics connected with referral links or an embedded Omniston widget, giving developers a way to route swaps from their own interfaces.
For STONK, the map is straightforward: defend the channel, reclaim resistance, then challenge the upper Fibonacci cluster. A breakdown below the marked base would invalidate that sequence.
NFA - DYOR!