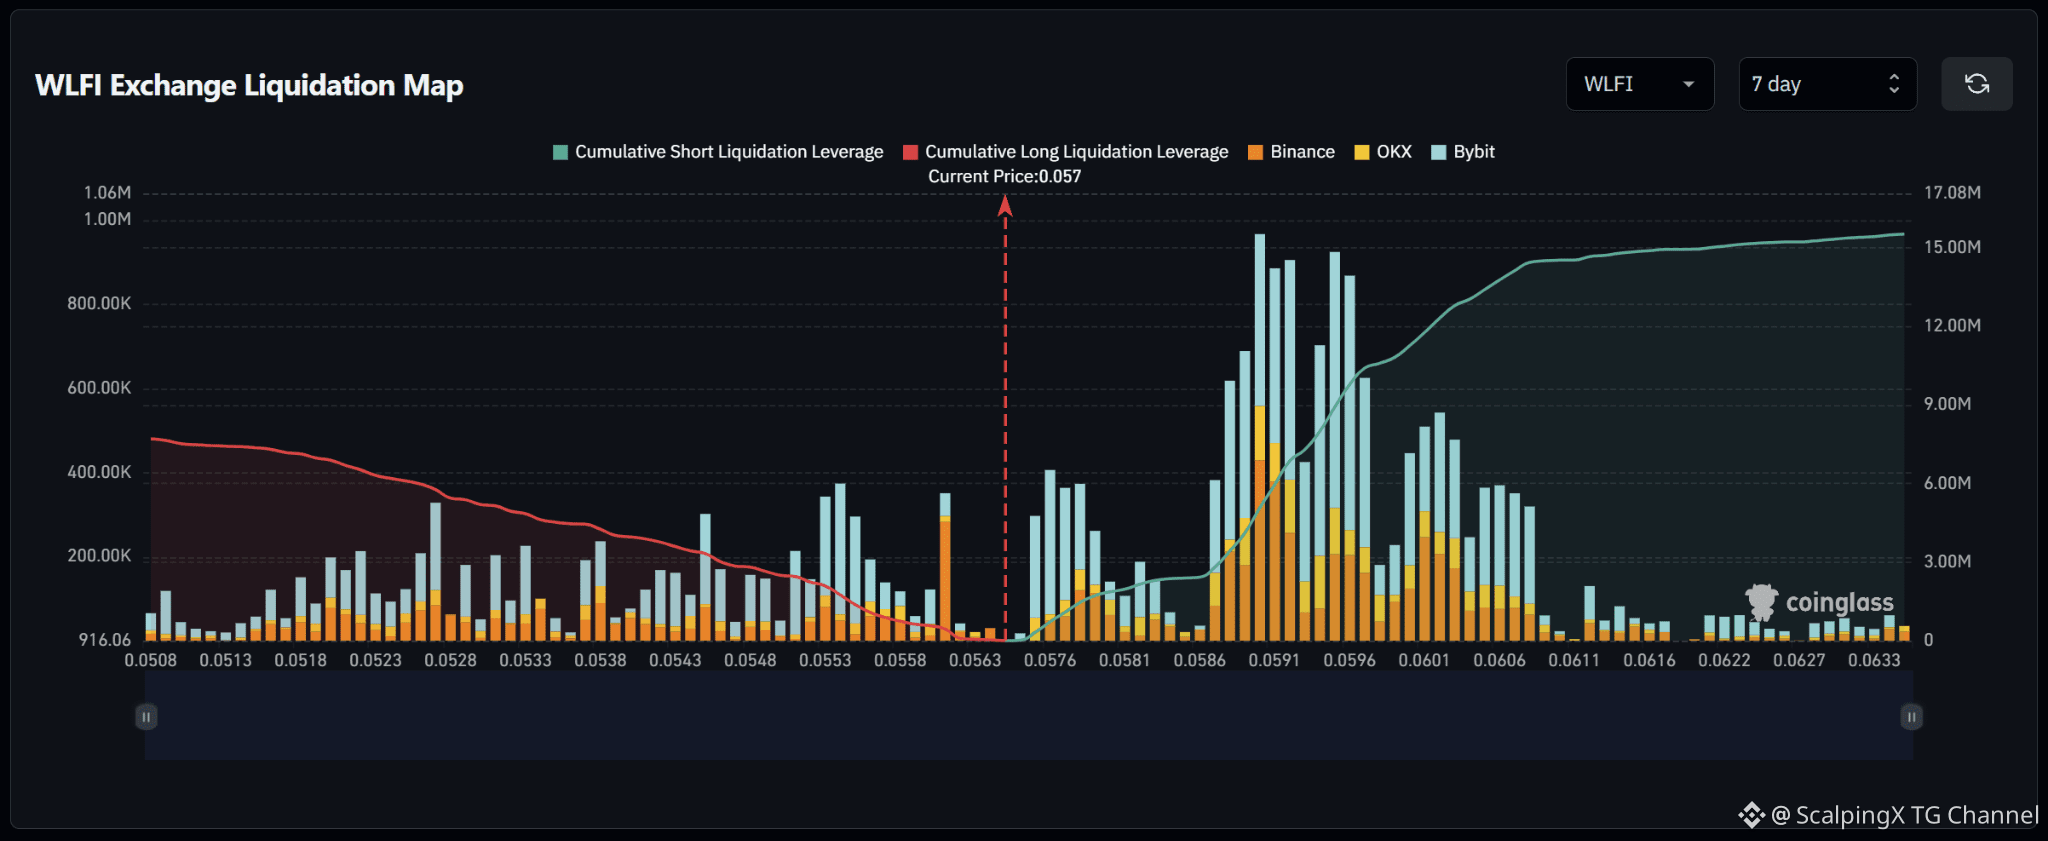
$WLFI – Liquidation Map (7 Days) – Current Price 0.057 🔎 The 7-day liquidation map shows roughly 15–16 million USD in short liquidations above the current price, significantly exceeding approximately 7–8 million USD in long liquidations below. The liquidity structure therefore clearly favors the upside, with around twice as much cumulative liquidity above the market. 📉 Below the market, long-liquidation liquidity is relatively dispersed. Notable clusters appear around 0.0552–0.0555 with a bar near 0.35–0.37 million USD, while the 0.0525–0.0545 area contains several smaller pockets around 0.15–0.30 million USD. Losing 0.0563 would shift attention toward 0.0555–0.0552 and then 0.0545–0.0538. 📈 Above the market, short-liquidation liquidity is heavily concentrated across 0.0586–0.0607. The strongest cluster sits around 0.0589–0.0596 with several bars near 0.7–0.95 million USD, while 0.0600–0.0604 also contains multiple bars around 0.45–0.55 million USD. This is currently the most prominent liquidity band on the map. 🧭 The broader setup clearly favors the upside because short-liquidation exposure above is roughly twice as large. Breaking above 0.0580 would expose 0.0589–0.0596; if momentum continues, 0.0600–0.0607 becomes the next major liquidity magnet. Losing 0.0563 would instead increase the probability of a sweep toward 0.0555–0.0552.


Posting