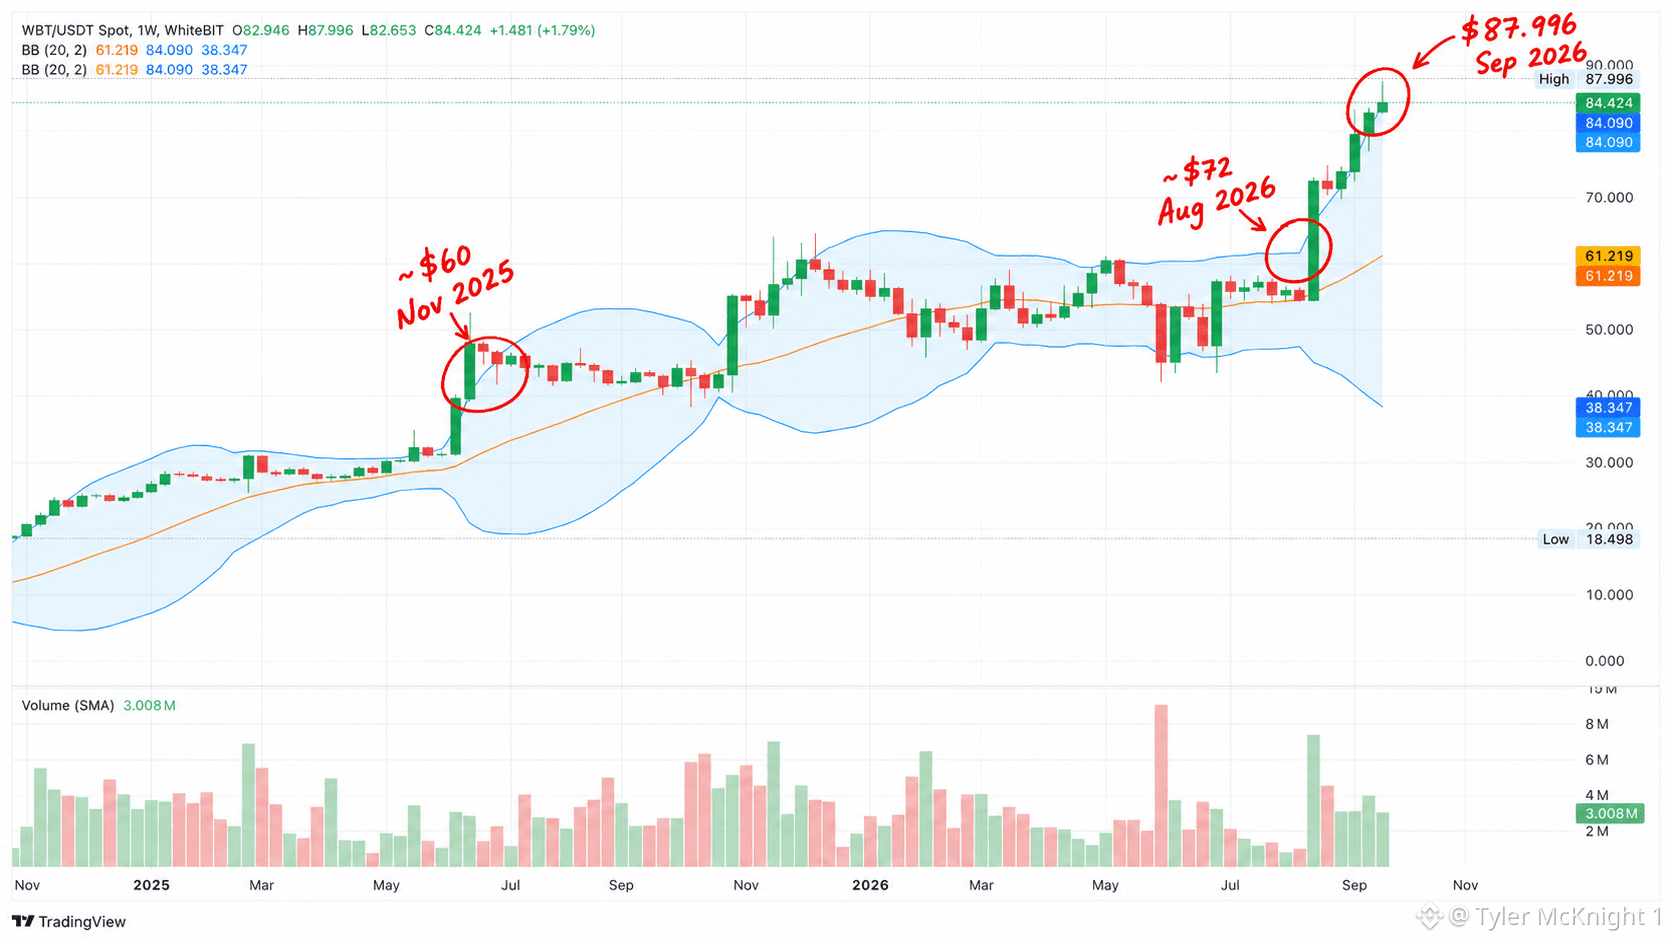
⚡ Not Every September ATH Came From the Same Setup A lot of projects hit new highs in September while $BTC was rallying. But the more I look at the charts, the less convincing the “it was just Bitcoin” explanation becomes. For example, $WBT is an interesting case here. On September 22, it reached a new ATH of $87.996 What interested me more was how it got there: not in one jump, but through several separate pushes higher. Such a chart structure made me go look back to its previous breakouts… 📍 $62.96 ATH - November 18, 2025 This ATH looks much calmer than the last one - more of a steady grind higher than one explosive breakout. I tried to find a catalyst behind it, but there really isn’t one right before the move: the WhiteBІT x Saudi deal and S&P inclusion both came after the ATH. So here I’d rather read the chart itself - WBT was holding up unusually well even while the broader market was weaker. 📊 Base: low-$40s Breakout: $55-60 After: months of consolidation. 📍 ~$72 breakout - August 2026 This one is much easier to connect with a specific moment. WBT had been stuck around $55-58 for weeks, then Whitechain relaunched as an Ethereum L2 in late August; and within days volume exploded and the whole price range shifted higher. 📊 Base: $55-58 Breakout: ~$72 After: $71-74 held, then $80+ within weeks. That’s probably the bigger takeaway for me from this chart: an ATH is the result, not the setup. Two coins can print new highs in the same market - and get there through completely different structures 💡 #BTC Price Analysis# #Altcoin Season#


Posting