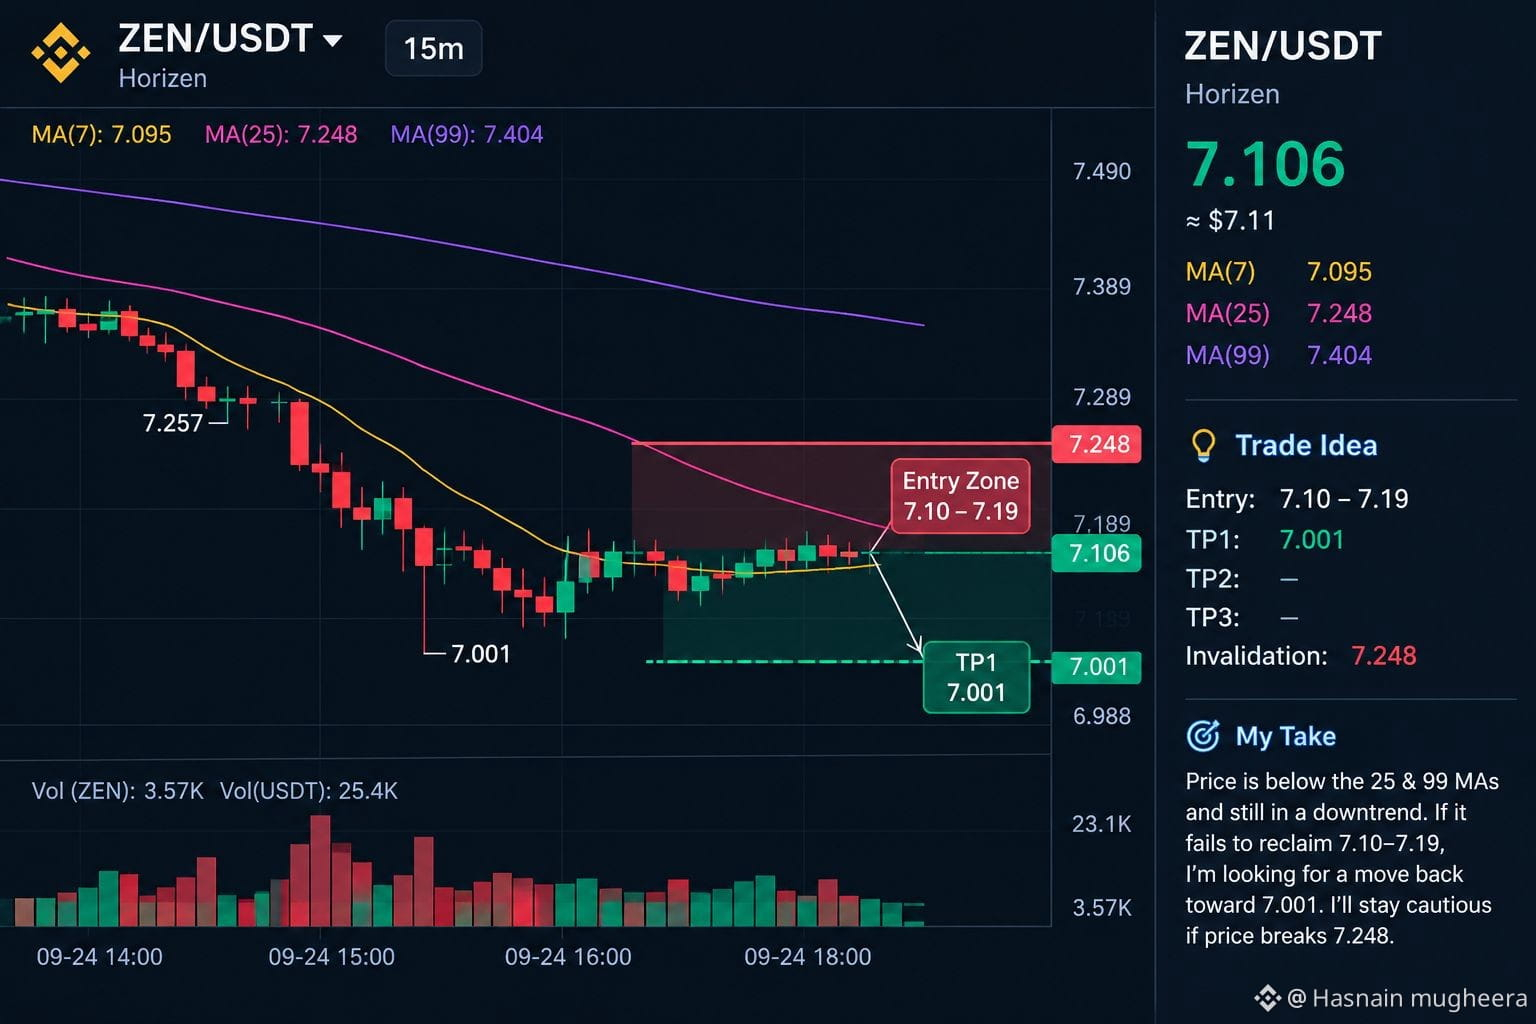
I’m looking at $ZEN /USDT on the 15m chart, and the structure still looks weak. Price is sitting around 7.106, with the MA(7) at 7.095, while MA(25) at 7.248 and MA(99) at 7.404 remain above price.
For me, the important area is 7.10–7.19. I’d like to see price fail to reclaim that zone and then move back toward the recent 7.001 low. The setup becomes more attractive if sellers regain control after this small bounce.
📍 Entry: 7.10–7.19 on rejection
🎯 TP1: 7.001
🛑 Invalidation: 7.248
I’m not adding TP2 or TP3 because the visible chart doesn’t provide a clear lower support level beyond 7.001 that I’d trust as a target.
If price loses 7.001, I’d step away from adding to the setup because that would mean the visible low has already broken and the chart doesn’t give me a clean next target.
The bounce around MA(7) is worth watching, but I’d rather wait for confirmation than chase the current candle.
For me, the important area is 7.10–7.19. I’d like to see price fail to reclaim that zone and then move back toward the recent 7.001 low. The setup becomes more attractive if sellers regain control after this small bounce.
📍 Entry: 7.10–7.19 on rejection
🎯 TP1: 7.001
🛑 Invalidation: 7.248
I’m not adding TP2 or TP3 because the visible chart doesn’t provide a clear lower support level beyond 7.001 that I’d trust as a target.
If price loses 7.001, I’d step away from adding to the setup because that would mean the visible low has already broken and the chart doesn’t give me a clean next target.
The bounce around MA(7) is worth watching, but I’d rather wait for confirmation than chase the current candle.