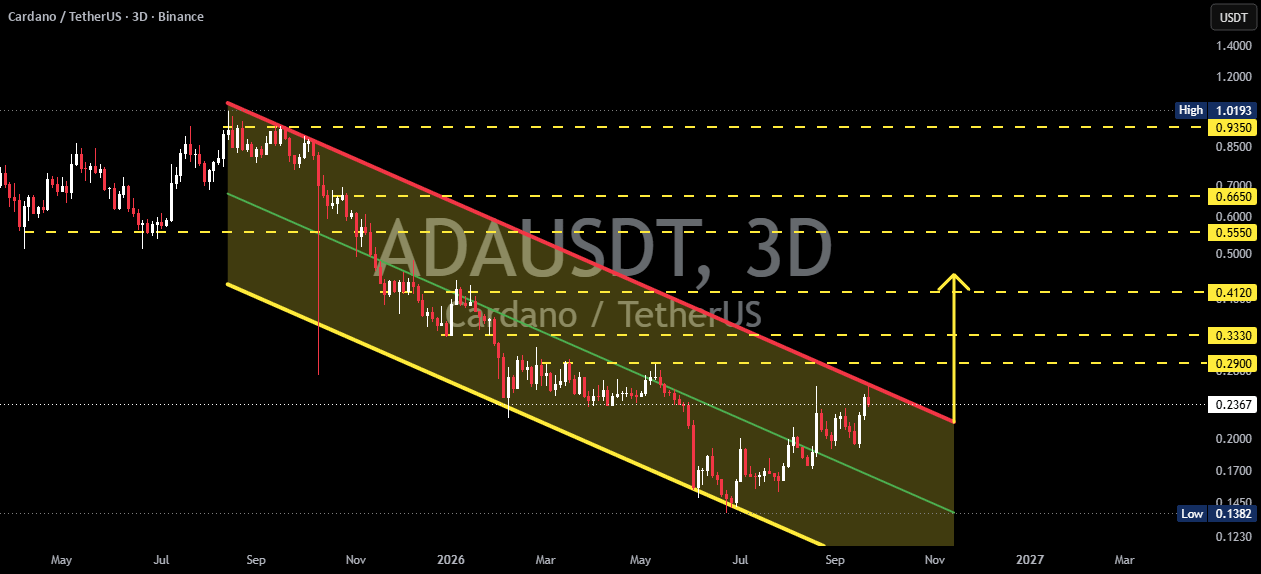

Coin: ADA
⌛ Time Frame: 3D
📉 Pattern: Descending Channel
🎯 Current Area: around $0.237–$0.29
🎯 Key Resistance: $0.2900 → $0.3330 → $0.4120 → $0.5550
🛡️ Key Support: $0.2370 → $0.1700 → $0.1450 → $0.1382
---
📉 Descending Channel Pattern
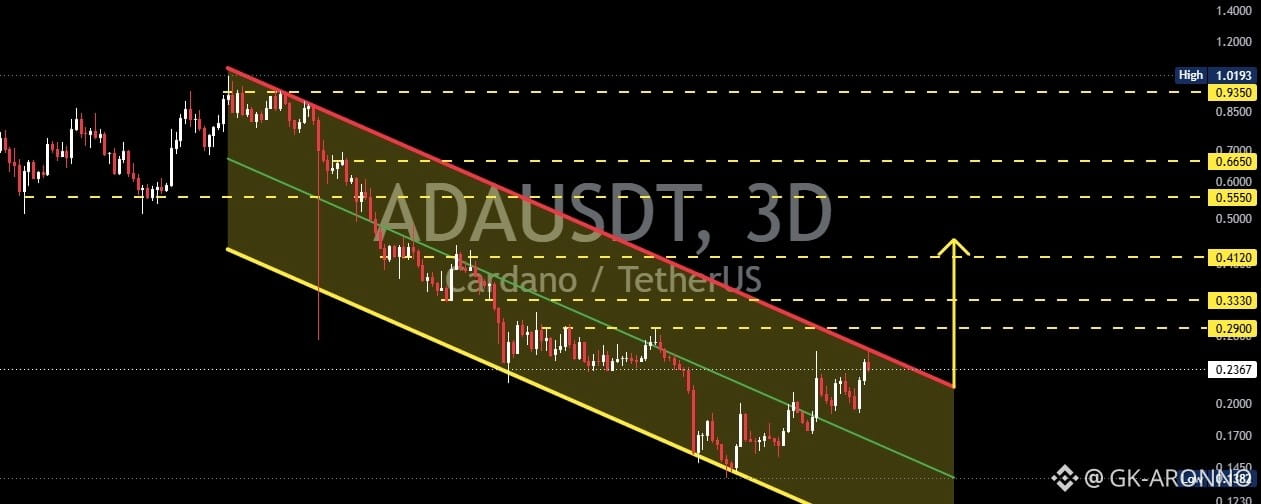
🔻 ADA/USDT appears to be moving within a Descending Channel, formed by two downward-sloping trendlines.
🔴 Upper Trendline: acts as dynamic resistance. Price has faced selling pressure several times when approaching this trendline.
🟢 Lower Trendline: acts as dynamic support and has previously served as an area where price found a rebound.
📌 This structure indicates that technically, price remains within a downtrend/channel structure as long as there is no valid breakout above the upper trendline.
🔥 However, price is currently moving closer to the upper channel resistance, making this an important area for determining the next potential direction.
---
🟢 Bullish Scenario
🚀 Bullish confirmation would become stronger if ADA manages to break out and close above the upper trendline of the Descending Channel on the 3D timeframe.
📈 Such a breakout could indicate that bearish pressure within the channel is weakening and that price may enter a recovery phase.
🎯 Next resistance targets:
🥇 $0.2900 — initial resistance / breakout area
🥈 $0.3330 — next resistance
🥉 $0.4120 — further target
🔥 $0.5550 — major resistance
🚀 $0.6650 — extension target if bullish momentum continues
⚠️ The stronger the volume and the clearer the 3D candle closes above the channel resistance, the stronger the breakout confirmation compared with merely a wick or false breakout.
---
🔴 Bearish Scenario
📉 If ADA is rejected again at the upper trendline, price could continue moving within the Descending Channel.
🔻 A rejection from resistance could create a potential move back toward the nearest support areas.
🎯 Key support levels to watch:
🛡️ $0.2370 — nearest support
🛡️ $0.1700 — next support
🛡️ $0.1450 — lower support
⚠️ $0.1382 — important low on the chart
💥 If price loses these support levels progressively and moves back toward the lower trendline, the Descending Channel structure remains valid and bearish pressure may continue.
---
⚡ Conclusion
📊 ADA/USDT is currently approaching an important area within the Descending Channel structure.
🔴 Bearish: rejection from the upper trendline → price could move back toward the channel support.
🟢 Bullish: valid breakout + close above the upper trendline → opens the possibility toward $0.2900 → $0.3330 → $0.4120 → $0.5550.
🎯 Key Level: $0.2900 is one of the important levels to watch to determine whether ADA can successfully break out of the descending structure.
⚠️ Note: The breakout should ideally be confirmed by a candle close and volume, as a breakout without confirmation can turn into a false breakout.