
🪙 Pair: XEC
⏱️ Time Frame: 4D
📈 Pattern: Descending Channel
💰 Current Price: Around 0.00000874
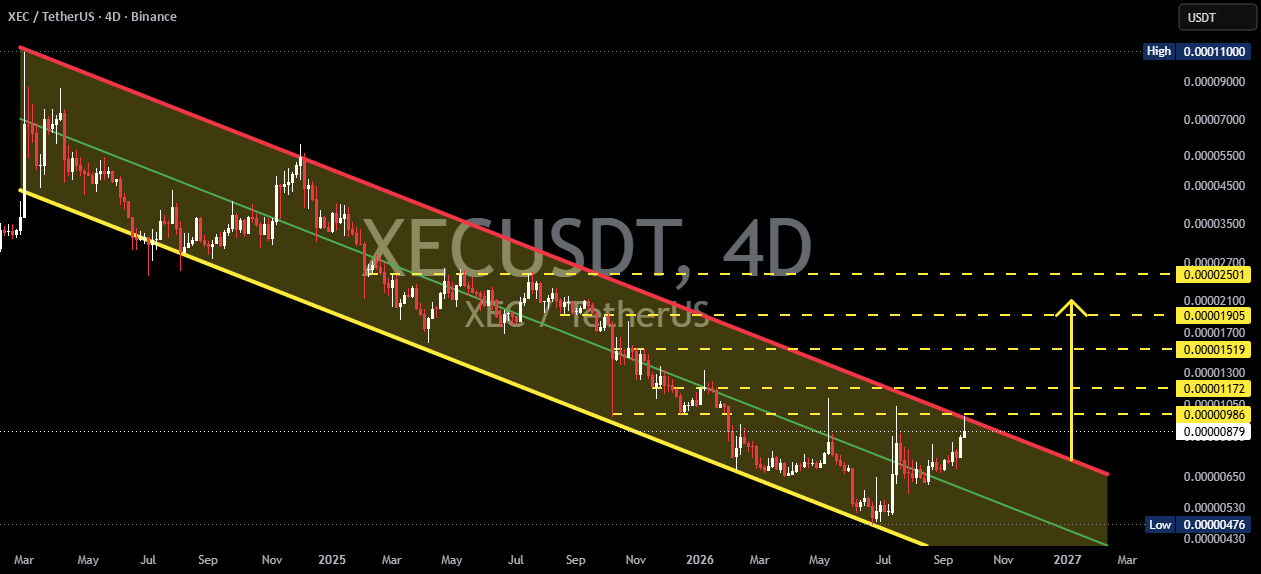
📉 XEC/USDT is currently trading within a long-term Descending Channel, characterized by two downward-sloping trendlines, with price fluctuating between the upper and lower boundaries.
🔴 The upper channel trendline acts as dynamic resistance, while the 🟡 lower channel trendline acts as dynamic support.
🔥 The chart shows that price has rebounded from the lower area of the channel and is now moving toward the upper channel resistance. This is a critical zone, as the price reaction around this resistance could determine whether XEC continues its recovery or faces another rejection.
---
📐 Descending Channel Pattern Explanation
🔻 A Descending Channel forms when:
🔴 Lower Highs continue to form below previous resistance levels.
🟢 Lower Lows gradually develop.
📉 Both channel boundaries slope downward.
🔄 Price tends to experience rejections at resistance and bounces from support.
⚠️ As long as price remains inside the channel, the broader structure continues to indicate bearish pressure.
However, a confirmed breakout above the channel resistance could signal a shift in momentum and potentially open the way toward the next horizontal resistance levels.
---
🟢 Bullish Scenario
🚀 The bullish scenario becomes more compelling if XEC successfully breaks out and holds above the Descending Channel resistance.
📌 Key confirmations to watch:
🟢 A 4D candle successfully closes above the channel resistance.
📈 The breakout is supported by increasing momentum/volume.
🔄 The broken resistance successfully turns into support.
💪 Price begins forming a Higher High / Higher Low structure.
🎯 Resistance targets shown on the chart:
1. 🟢 0.00000986
2. 🟢 0.00001172
3. 🟢 0.00001519
4. 🟢 0.00001905
5. 🚀 0.00002501
🔥 If the breakout is successfully confirmed, these levels could become the next resistance areas to watch progressively.
---
🔴 Bearish Scenario
⚠️ The bearish scenario remains valid as long as XEC fails to break above the Descending Channel resistance.
📉 If price experiences rejection at the resistance and moves back deeper into the channel, selling pressure could increase again.
🔻 Bearish confirmation could appear if:
❌ Price fails to break above resistance.
📉 A strong rejection occurs from the upper channel boundary.
🔴 Price forms another Lower High.
🧱 Nearby support levels begin to break down.
🎯 Under this scenario, attention could shift back toward the support/dynamic support area of the channel, particularly around 0.00000650–0.00000476, based on the structure shown on the chart.
---
🔥 KEY XEC/USDT LEVELS
🟡 0.00000874 → Current price area
🔴 Descending Channel Resistance → Main breakout zone
🟢 0.00000986 → First resistance
🟢 0.00001172 → Next resistance
🟢 0.00001519 → Further resistance
🟢 0.00001905 → Major resistance
🚀 0.00002501 → Upper resistance target shown on the chart
🔻 0.00000650–0.00000476 → Lower channel/support area
---
🧠 Conclusion
📊 XEC/USDT is currently approaching an important stage within its Descending Channel structure.
🔥 Price has rebounded from the lower area of the channel and is now approaching the major upper resistance.
🟢 Breakout + 4D close above the channel resistance → could open the way toward 0.00000986 → 0.00001172 → 0.00001519 → 0.00001905 → 0.00002501.
🔴 Rejection from resistance → could keep the Descending Channel structure intact and increase the possibility of price moving back toward the lower support area.
⚠️ The key factor in this chart is how XEC reacts to the upper boundary of the Descending Channel. A breakout should ideally be confirmed by a candle close rather than just a temporary wick above resistance.