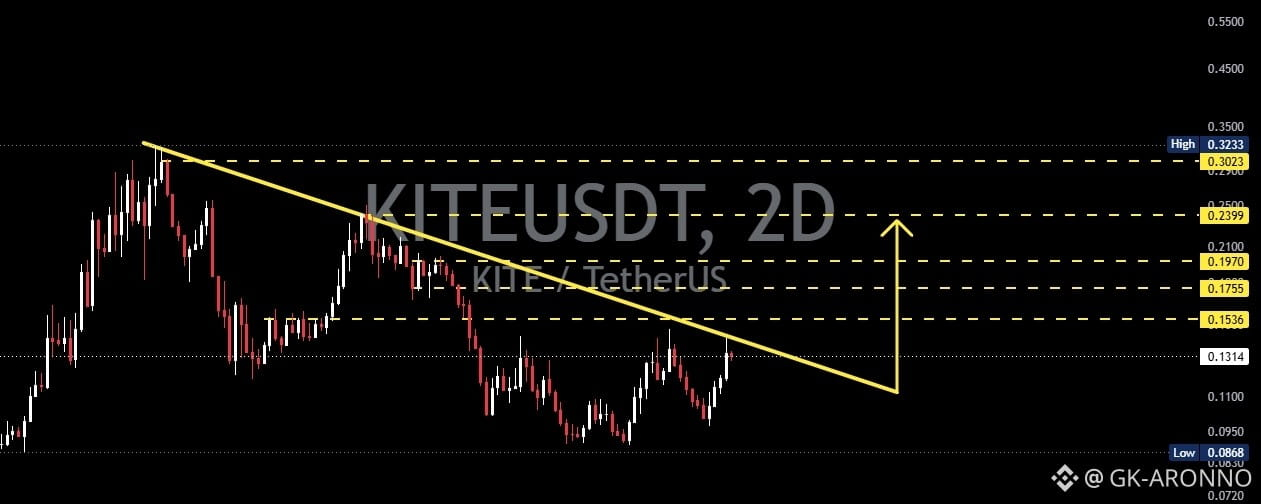

KITE/USDT appears to be moving under bearish pressure after forming a series of lower highs, with a descending trendline connecting previous swing highs.
🟡 The Descending Trendline on the chart acts as a dynamic resistance. As long as price remains below this trendline, selling pressure remains a factor to watch.
🔥 However, price is now approaching an important area around the Descending Trendline, making the next reaction potentially important for determining the short-term direction.
---
🟡 KEY LEVELS
🔹 $0.1536 — Initial resistance
🔹 $0.1755 — Next resistance
🔹 $0.1970 — Important resistance
🔹 $0.2399 — Major resistance / next target
🔹 $0.3023 — Major resistance / extended target
🟢 $0.1317 — Current price area shown on the chart
🔴 $0.1100 – $0.0950 — Important support zone
🔴 $0.0868 — Major low / critical support
---
🟢 BULLISH SCENARIO — BREAKOUT
🚀 The bullish scenario becomes more relevant if KITE successfully breaks above the Descending Trendline and manages to hold above it.
📈 A breakout accompanied by a strong 2D candle close above the trendline could indicate that the dynamic resistance is being overcome.
🎯 If the breakout is confirmed, the next resistance areas to watch are:
➡️ $0.1536
➡️ $0.1755
➡️ $0.1970
➡️ $0.2399
➡️ $0.3023
🔄 After the breakout, a retest of the Descending Trendline should also be monitored. If the trendline turns into support and successfully holds, the bullish structure could receive additional confirmation.
---
🔴 BEARISH SCENARIO — REJECTION
⚠️ If KITE fails to break above the Descending Trendline and gets rejected, bearish pressure could continue.
📉 A rejection from the trendline could push price back toward the nearest support areas.
🔻 Key areas to watch:
➡️ $0.1100
➡️ $0.0950
➡️ $0.0868
💥 If $0.0868 is strongly broken, the price structure could show further weakness and the bearish setup may become more dominant.
---
📚 PATTERN EXPLANATION — DESCENDING TRENDLINE
📉 A Descending Trendline forms when price consistently creates lower highs, with those swing highs connected by a trendline sloping downward.
🟡 On the KITE/USDT chart, the yellow line represents dynamic resistance that has repeatedly limited upward price movement.
🔄 The pattern itself is not confirmation of a breakout. The next direction should be confirmed by how price reacts when it reaches the trendline.
🚀 Upside Breakout: Could indicate a shift in momentum and open the way toward the next resistance levels.
🔻 Rejection: Could maintain the bearish structure and increase the possibility of another test of lower support levels.
---
🎯 KEY CONFIRMATION
🟢 Bullish Confirmation: Breakout + 2D candle close above the Descending Trendline + successful retest.
🔴 Bearish Confirmation: Rejection from the Descending Trendline + formation of a new lower high + breakdown of the next support.
⚠️ Note: The levels above are technical areas based on the chart and do not guarantee future price movement.