



Akash Network’s $AKT just caught a strong bid.
The token jumped 14.12%, pushing above a multiweek range as money continued rotating into AI, decentralized compute and infrastructure-related tokens.
What makes this move interesting is that trading activity didn’t stay quiet.
AKT’s 24-hour volume surged 189.6% to $21.9 million, showing that the move came with a noticeable increase in market participation.
That gives the rally more substance than a simple low-volume breakout.
Whales Are Showing Up
There’s another interesting signal behind the move.
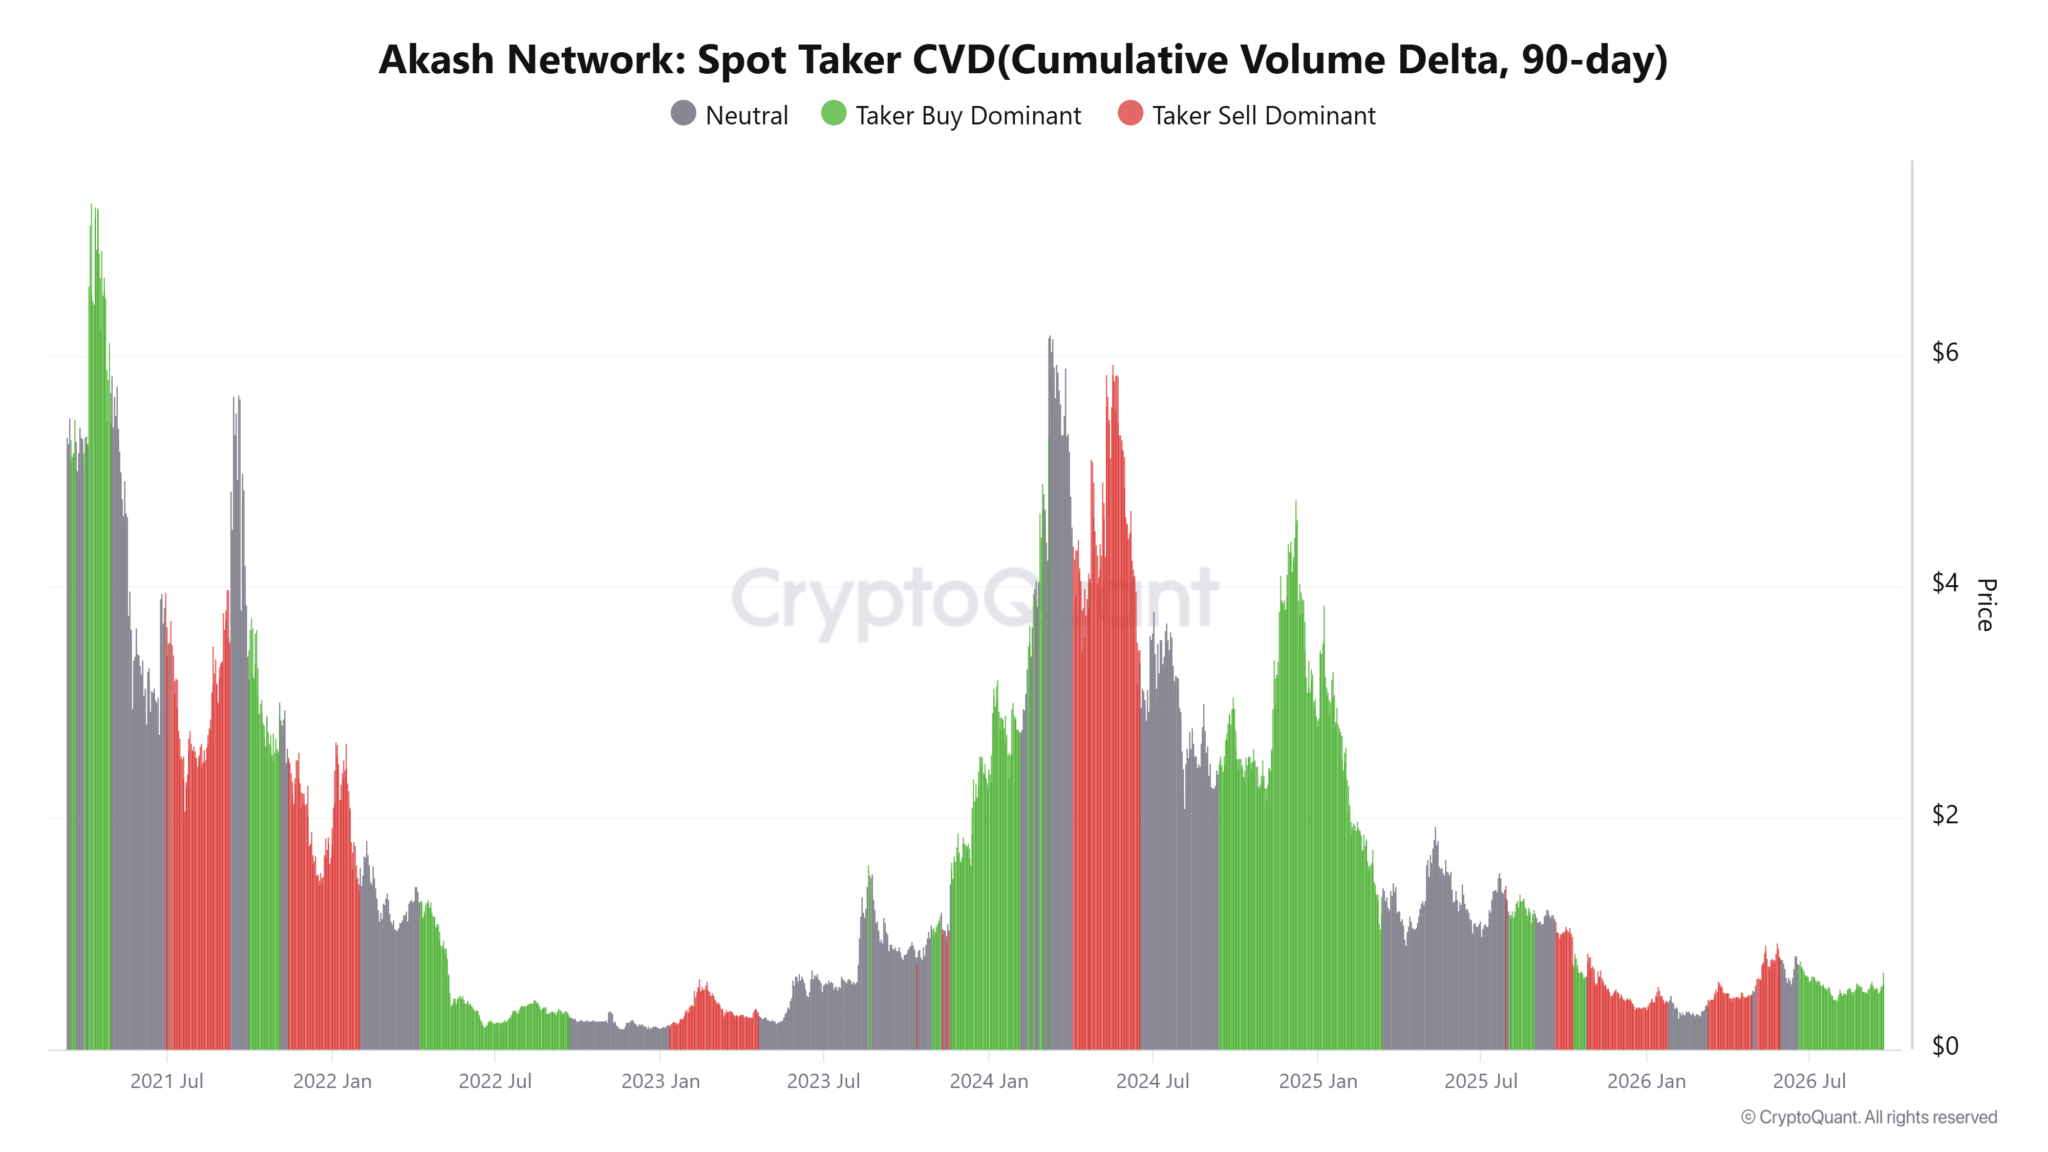
According to CryptoQuant, AKT’s Spot Average Order Size showed “Big Whale Orders,” suggesting larger transactions were entering the market during the rally.
At the same time, the Spot Taker CVD remained Taker Buy Dominant.
In simple terms, aggressive buyers were crossing the spread more frequently than sellers.
So the current move isn’t being driven only by the broader AI narrative. Spot demand and larger orders are also showing up alongside the price increase.
But now comes the important part: can AKT hold the breakout?
The $0.5968 Level Matters
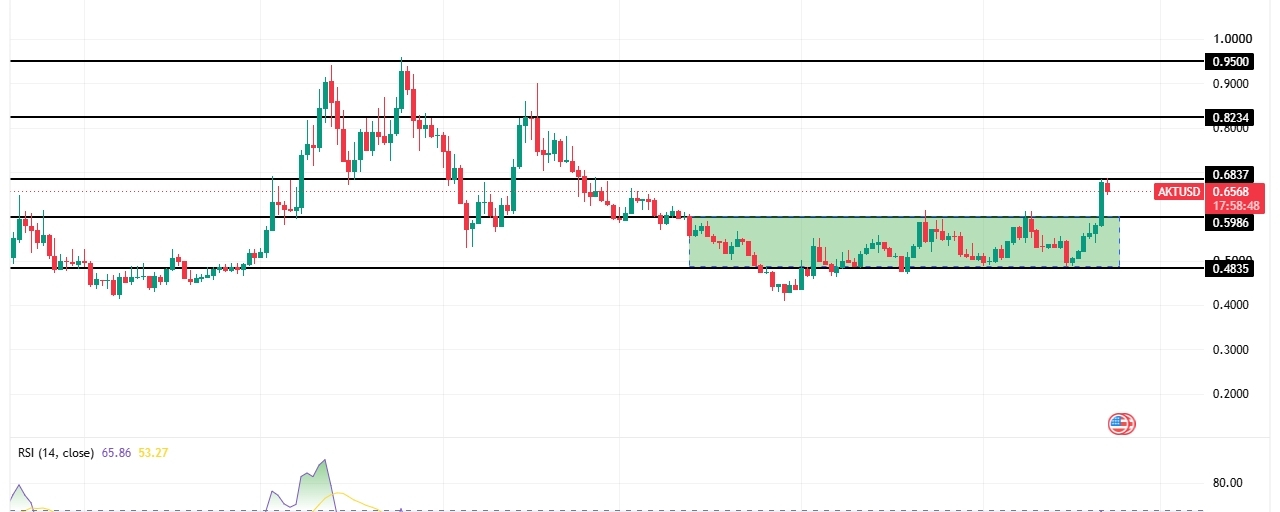
On the 24-hour chart, AKT broke above the $0.5968 boundary, ending a multiweek consolidation that had formed above $0.4835.
After the breakout, buyers pushed the price toward $0.6837, with the move briefly reaching around $0.6870 before pulling back.
The interesting thing is that price is still holding above the former range ceiling.
That means $0.5968 could become an important support level if AKT sees a deeper retracement.
The RSI also climbed to 65.86, while its average remained around 53.27. Momentum has clearly strengthened, but RSI is still below the traditional 70 overbought level.
So there is still room for momentum to continue if buyers remain in control.
What Comes Next?
The levels are pretty straightforward from here.
If buyers defend $0.5968, another attempt at $0.6837 becomes possible.
A sustained break and hold above $0.6837 could put the $0.8234 area into focus next.
But there’s another reason the $0.69–$0.70 zone could become interesting.
Liquidity Sitting Above Resistance
The 24-hour Binance liquidation heatmap shows notable liquidation clusters around $0.69–$0.70, just above the current resistance area.
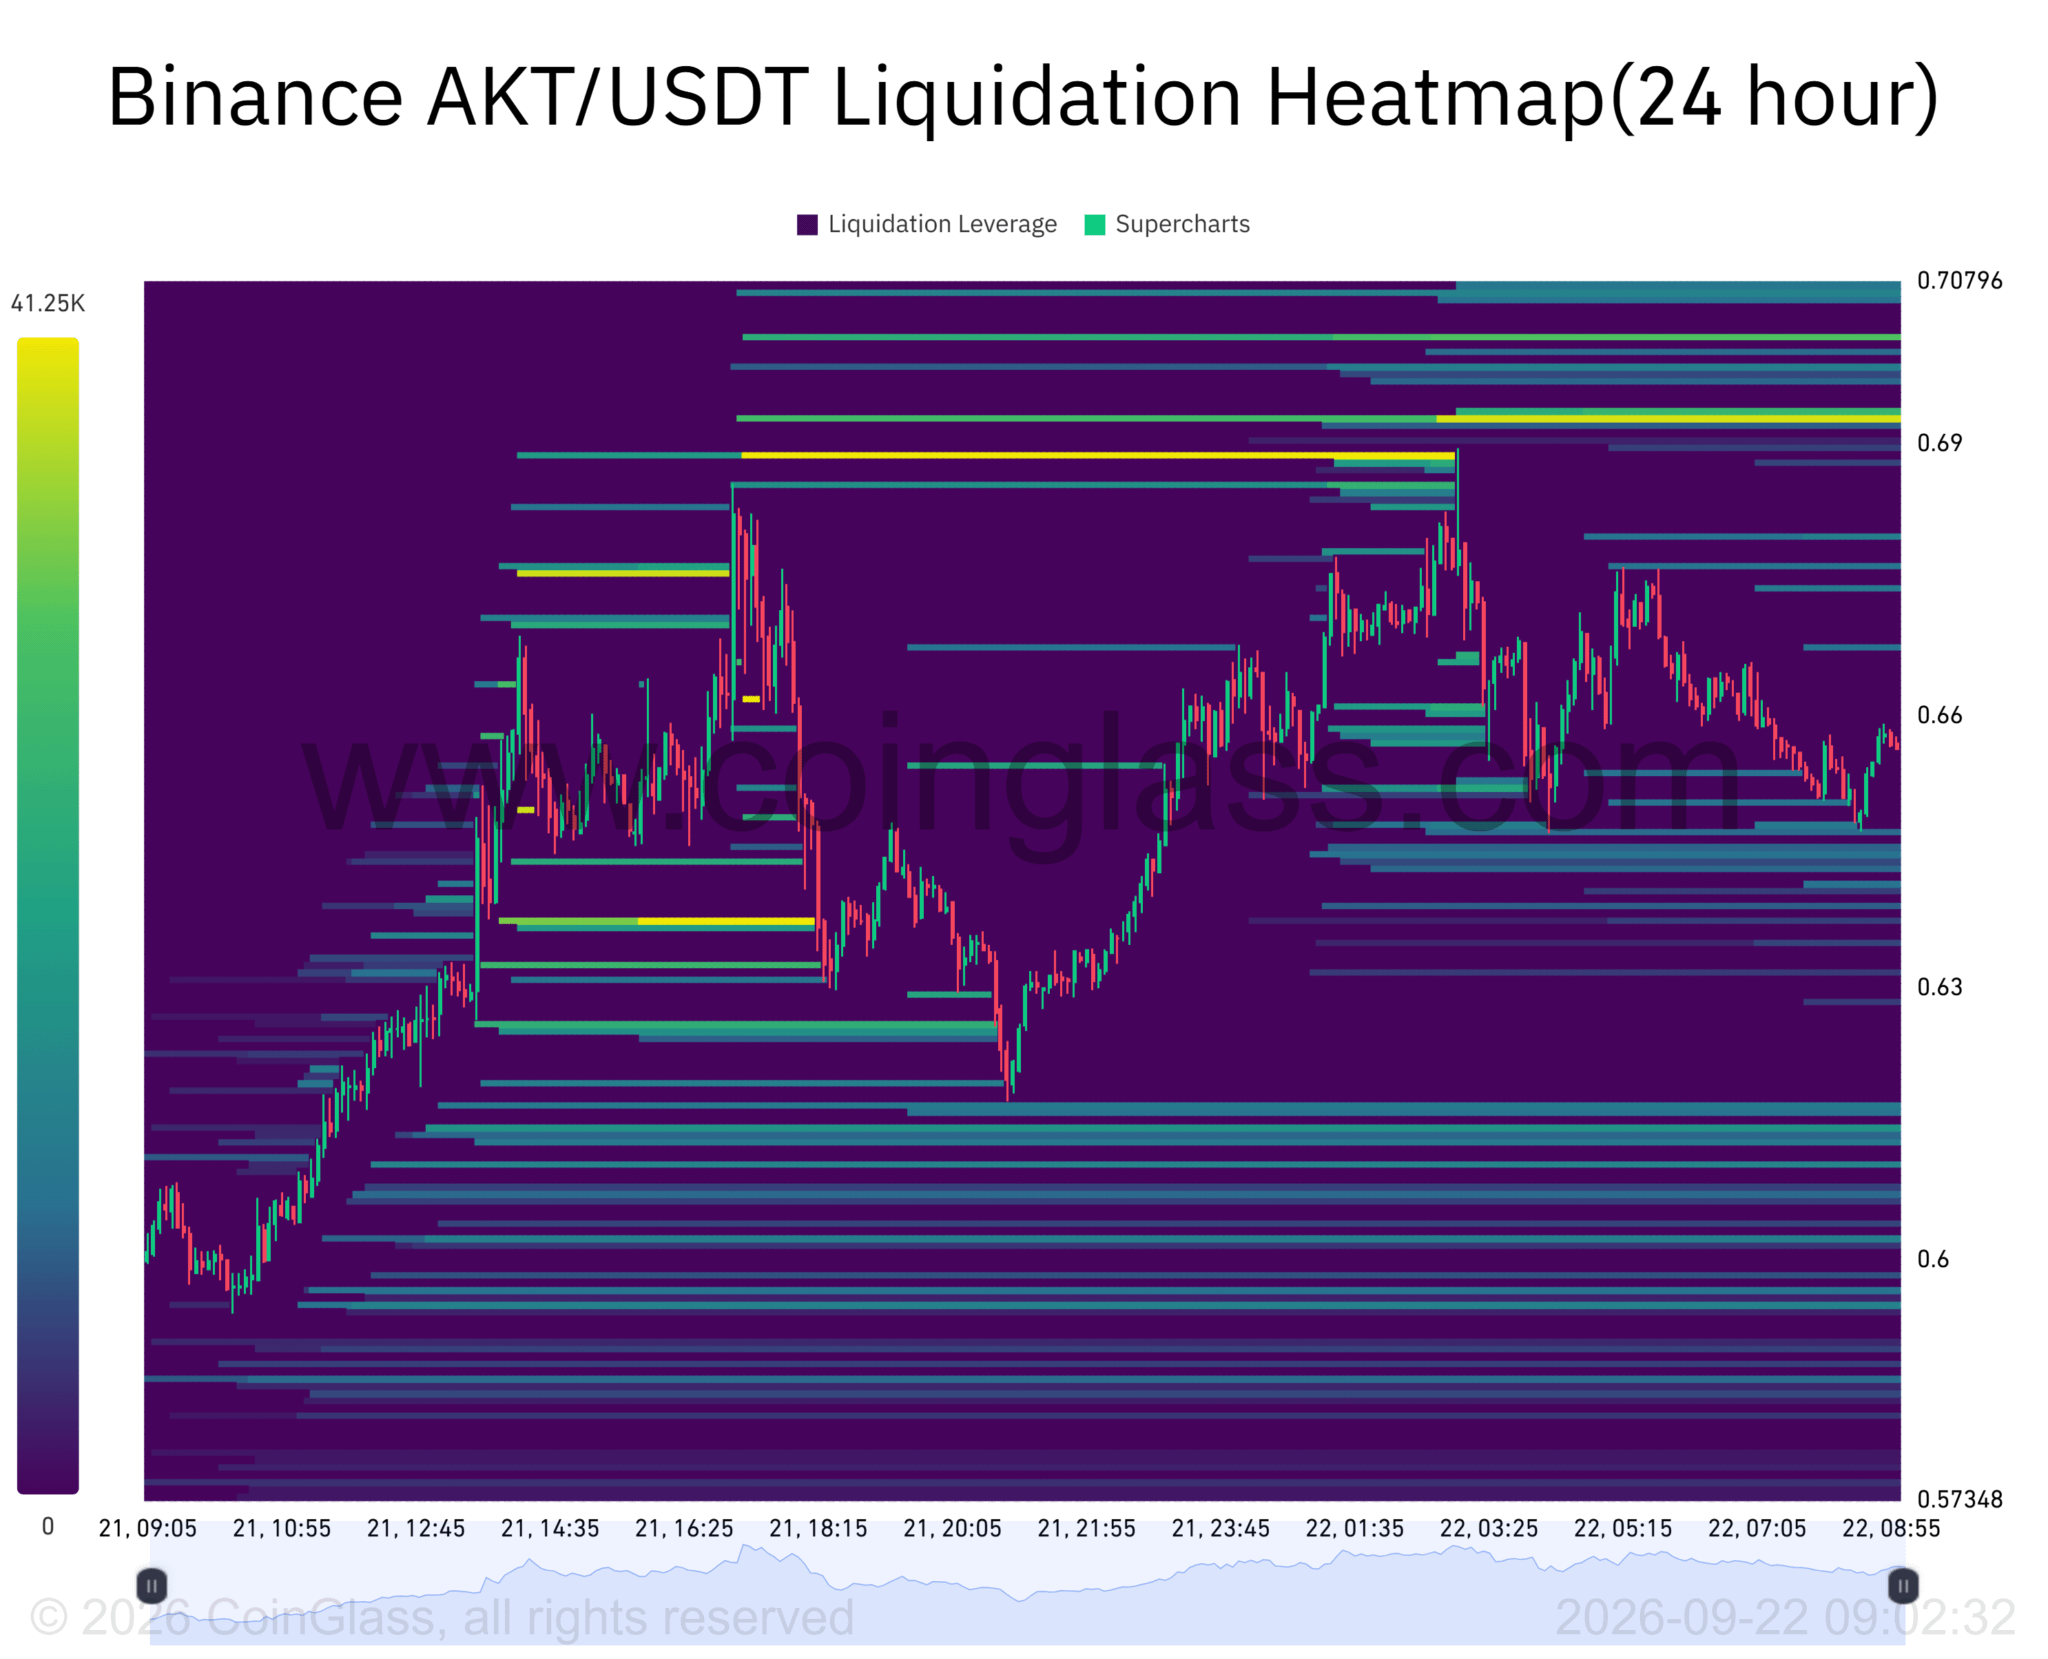
If AKT pushes through $0.6837, those nearby short liquidations could add another wave of buying pressure and potentially accelerate the move.
Of course, liquidity alone doesn’t guarantee a breakout.
If AKT gets rejected around the resistance zone, attention shifts back to the breakout level.
For now, the key levels to watch are:
$0.5968 — support
$0.6837 — resistance
$0.69–$0.70 — liquidation liquidity zone
$0.8234 — potential upside target
AKT has momentum, rising volume, stronger spot demand and whale-sized orders behind the recent move.
Now the real test is whether buyers can turn this breakout into a sustained move rather than another rejection.