

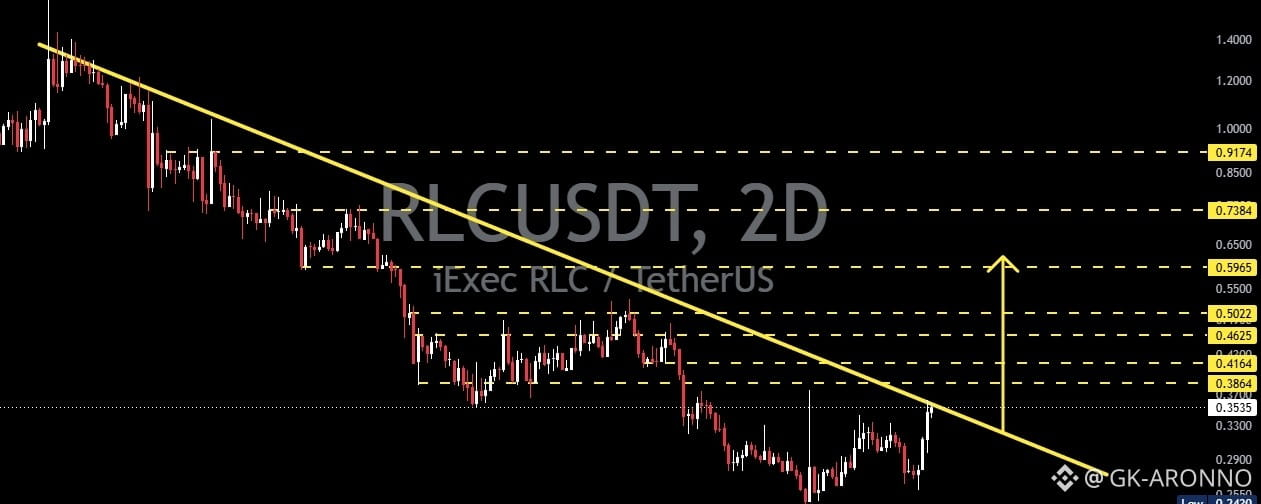

The chart shows iExec RLC (RLC) still trading within a Descending Trendline structure that has pressured price since the major high around $1.30–$1.40. The current price is around $0.3531 and is approaching the main descending resistance / trendline.
📐 Pattern: Descending Trendline
🔻 A Descending Trendline forms when price creates a series of lower highs, with each upward move being rejected by a declining resistance line.
📉 On this chart, the yellow trendline connects several previous rejection areas and acts as the main dynamic resistance.
⚠️ As long as price remains below the trendline, the medium-to-long-term structure remains bearish.
🔥 However, the current position is interesting because RLC is approaching this major trendline. A confirmed breakout could represent an important structural shift.
---
🟢 Bullish Scenario — Breakout Confirmation
🚀 The bullish scenario becomes more relevant if RLC breaks above the descending trendline and successfully closes a 2D candle above it.
📈 A stronger breakout confirmation would ideally include:
✅ 2D candle closing above the trendline
✅ Price holding above the trendline
✅ Successful retest of the trendline as support
✅ Formation of a higher high / higher low
✅ Increasing volume during the breakout
🎯 If the breakout is confirmed, the following horizontal resistance levels become important areas to watch:
🎯 Target 1: $0.3864
🎯 Target 2: $0.4164
🎯 Target 3: $0.4625
🎯 Target 4: $0.5022
🎯 Target 5: $0.5965
🎯 Target 6: $0.7384
🎯 Target 7: $0.9174
🔥 The $0.5022–$0.5965 zone is particularly important because it represents a higher resistance area within the chart structure.
🚀 If momentum continues and this resistance zone is successfully broken, attention could shift toward $0.7384–$0.9174.
---
🔴 Bearish Scenario — Rejection from the Trendline
⚠️ The bearish scenario remains valid if RLC gets rejected again by the descending trendline.
📉 If price fails to break out and moves back below the $0.3531 area, selling pressure could increase.
🔻 Key areas to watch:
Support 1: Around $0.3300
Support 2: $0.3000–$0.2900
Support 3: Around $0.2430
💥 If the descending trendline rejects price again, the lower-high structure could continue, potentially leading to another retest of these support levels.
---
🔎 Key Levels to Watch
🟡 $0.3531 — Current price / initial breakout zone
🟡 $0.3864 — First resistance after breakout
🟡 $0.4164 — Next resistance
🟡 $0.4625 — Important resistance
🟡 $0.5022 — Psychological & structural resistance
🟡 $0.5965 — Major resistance
🟡 $0.7384 — Higher resistance
🟡 $0.9174 — Major resistance / upside target area
🔻 $0.2430 — Important low on the chart
---
🧠 Technical Analysis Conclusion
📊 RLC is approaching a critical area as price tests the long-term descending trendline.
🔴 Below the trendline: The bearish structure remains dominant, and another rejection could open the possibility of a retest of lower support levels.
🟢 Breakout + 2D close above the trendline: Could indicate that bearish pressure is weakening and potentially open the way toward the next resistance levels.
🔥 The key factor is not simply whether price touches the trendline, but how price reacts after testing it.
> 📌 Breakout = Confirmation
📌 Rejection = Bearish continuation
📌 Successful retest = Stronger bullish confirmation
⚠️ This analysis is based on the technical structure shown on the chart and does not guarantee future price movement.
