
💵 Coin: PROVE
⌛ Time Frame: 2D
📐 Pattern: Descending Trendline
💰 Current Price: around $0.2275
---
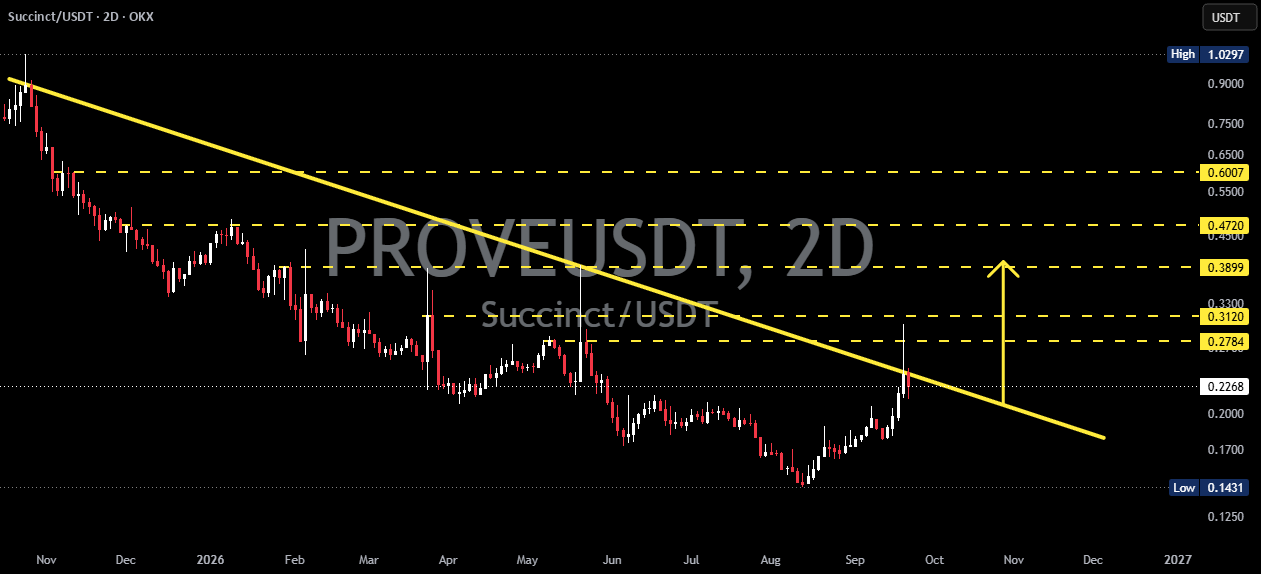
📉 Descending Trendline Structure
🔻 The chart shows a Descending Trendline formed by a series of lower highs since the peak around $0.90+.
📉 This descending trendline has acted as dynamic resistance, causing previous price recoveries to face selling pressure.
🔄 However, the latest structure shows a recovery from the low around $0.1431, with price now moving upward toward the main trendline.
⚠️ The $0.2275–$0.2784 area is an important zone as price approaches the resistance created by the descending trendline.
---
🟢 BULLISH SCENARIO
🚀 The bullish scenario becomes increasingly valid if PROVE breaks out and closes strongly above the Descending Trendline.
📈 Such a breakout could indicate that bearish pressure from the trendline is weakening, potentially allowing the price structure to enter a reversal or recovery phase.
🎯 Upside Levels:
🥇 $0.2784 — Initial resistance / breakout confirmation zone
🥈 $0.3120 — Next target
🥉 $0.3899 — Major resistance
🎯 $0.4720 — Next resistance
🚀 $0.6007 — Major upside target
💡 The stronger the volume accompanying the breakout, the more significant the confirmation may be in reducing the risk of a false breakout.
---
🔴 BEARISH SCENARIO
⚠️ If price fails to break the Descending Trendline and receives another rejection, the bearish structure remains valid.
📉 A rejection from the trendline could cause price to retest the nearest support areas.
🔻 Key levels to watch:
🟡 $0.2275 — Current price area
🔻 $0.2000–$0.1900 — Minor support
🔻 $0.1700 — Next support
🛡️ $0.1431 — Major support / recent low
💥 If $0.1431 is decisively broken, the recovery structure could weaken again and bearish pressure may increase.
---
🧩 Pattern Explanation — Descending Trendline
📐 A Descending Trendline is a trendline connecting a series of lower highs, indicating that sellers continue to dominate price rallies.
🔻 On this chart, the trendline acts as dynamic resistance.
🔄 As long as price remains below the trendline, the bearish structure has not been fully invalidated.
🚀 Conversely, a breakout + close above the trendline could signal a potential change in market structure, which should be confirmed by volume and subsequent price action.
⚠️ Do not rely solely on a wick breakout. A clear candle close above the trendline provides a more meaningful confirmation.
---
🎯 Key Levels
🟢 Bullish:
$0.2784 → $0.3120 → $0.3899 → $0.4720 → $0.6007
🔴 Bearish:
$0.2275 → $0.2000 → $0.1700 → $0.1431
---
📌 Conclusion
🔎 PROVE is currently at an important area as price approaches the major Descending Trendline.
🚀 Breakout & close above the trendline → could open the way toward $0.2784, $0.3120, and $0.3899, with higher levels around $0.4720–$0.6007.
🔻 Rejection from the trendline → keeps the bearish structure intact and could lead to a retest of $0.20, $0.17, and potentially $0.1431.
📊 Key confirmation level: $0.2784
> ⚠️ This analysis is based on technical structure and chart patterns. It is not financial advice. Always manage risk and wait for confirmation before making trading decisions.