

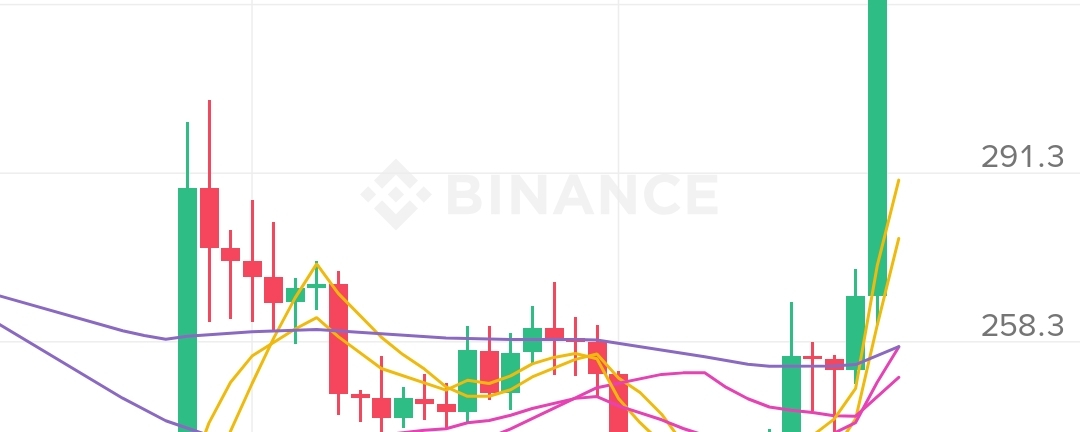

BCH/USDT Technical Analysis 📊
Current Price: $340.4
Buy Average: $343.2
24H High: $349.9
24H Low: $261.6
24H Change: +28.02%
🔍 Market Overview
BCH is currently showing a strong bullish trend, supported by a large daily green candle and a significant increase in trading volume.
However, after such a sharp 28%+ move, the possibility of a short-term pullback or correction is also high.
🚀 Bullish Scenario
If BCH can break and close a daily candle above $350 with strong volume, the next potential levels to watch are:
$357–360 → $370 → $380+
A confirmed breakout above $350 could indicate further bullish continuation.
🔄 Pullback Scenario
If BCH fails to break $350 and starts correcting, the first important support zone is:
$324–325
If this level holds and buyers step in, BCH could potentially retest:
$340 → $350
🔴 Bearish/Correction Scenario
If BCH breaks below $324–325 and closes a daily candle below this area, the next important support zone could be:
$290–291
If $290 also fails, the next major support area is around:
$257–260
🛑 Stop-Loss Considerations
For traders managing risk, possible areas to monitor are:
Tight stop: $330–333
Support-based stop: Around $319–322
These are not guaranteed levels; BCH is highly volatile, so position sizing and risk management are important.
🕯️ Candlestick Analysis
The current candle has tested around $349.9 and then pulled back toward $340.4.
This suggests some selling pressure near $350 resistance.
However, the daily candle must close before treating this as a confirmed bearish signal.
📌 Key Levels
Resistance: $349–350
Support: $324–325
EMA(7): ~$290
Major Support: $257–260
🎯 My Current Chart View
Medium-Term Trend: 🟢 Bullish
Short-Term: 🟡 Highly volatile / Pullback risk
$350: Major resistance
$324: Important support
$290: Next major support
Key question: Will BCH break above $350, or will it pull back toward $324 first?
Always manage risk carefully. No single candle or indicator guarantees the next price move.
#BCH #BCHUSDT #Crypto #Binance #Trading #CryptoTrading #Altcoins