

Today’s signal
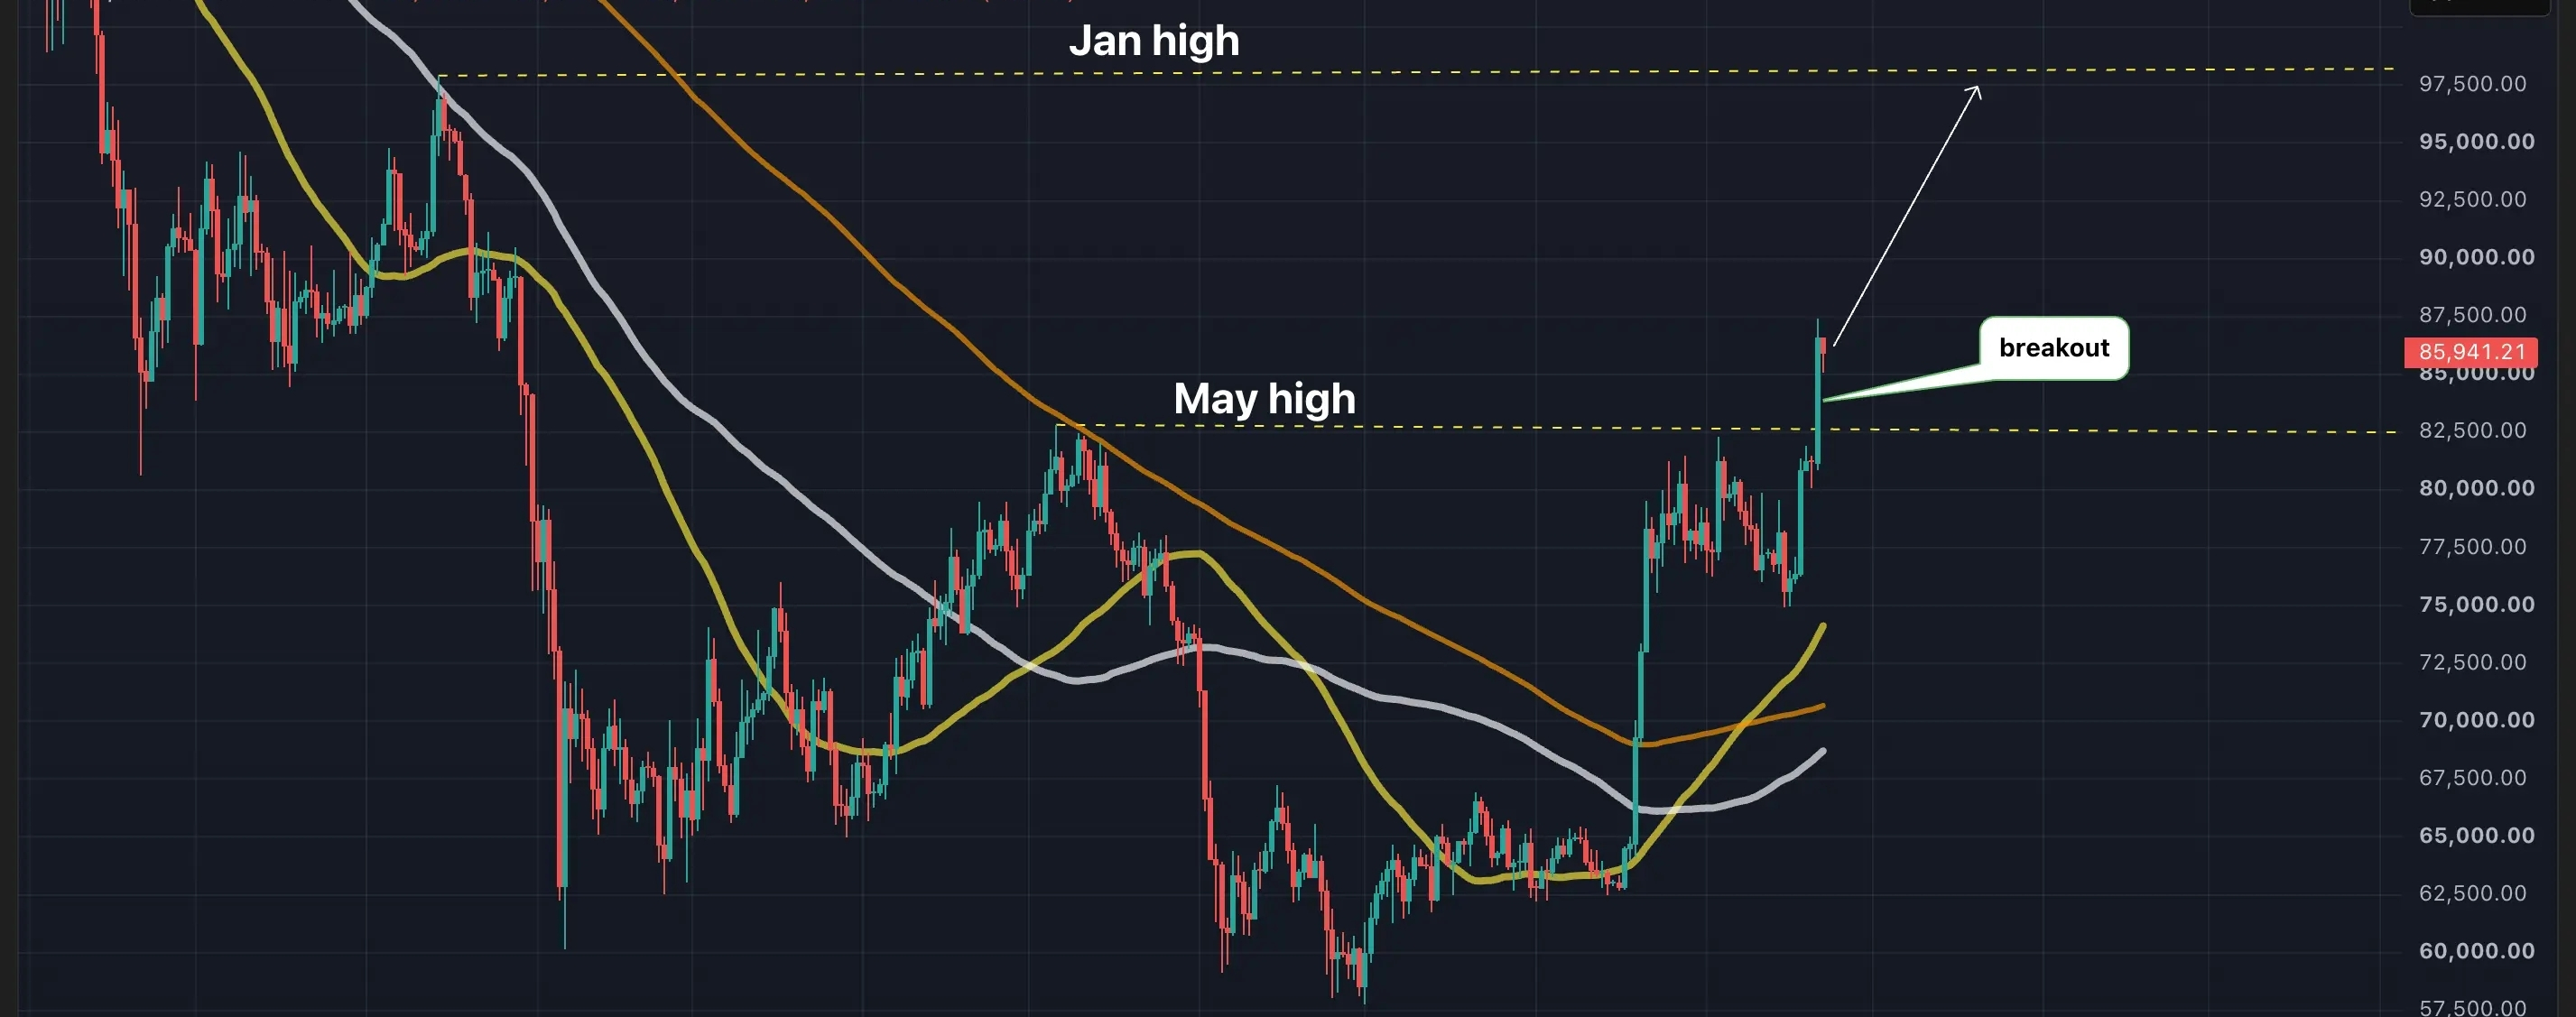
BTC's daily price swings in candlestick format. (TradingView)
BTC's daily price chart. (TradingView)
The chart shows bitcoin’s daily price swings in candlestick format. Overlaid on the chart are 50-, 100- and 200-day moving averages.
BTC is trading well above all three averages, a bullish configuration.
"BTC has reclaimed every one of its long-term moving averages. After around 300 days underneath them, this dynamic has now flipped. Holding above them is what maintains a long-term uptrend," Glassnode said.
In addition, BTC’s Monday candle ended well above the May high, topping the key resistance to mark yet another bullish breakout. The next big resistance, or level, from where markets fell, is marked by the January high of above $98,000.
#BitcoinBreaksAboveMayHighNears$86K
#CryptoMarketCapReclaims$3Trillion
