
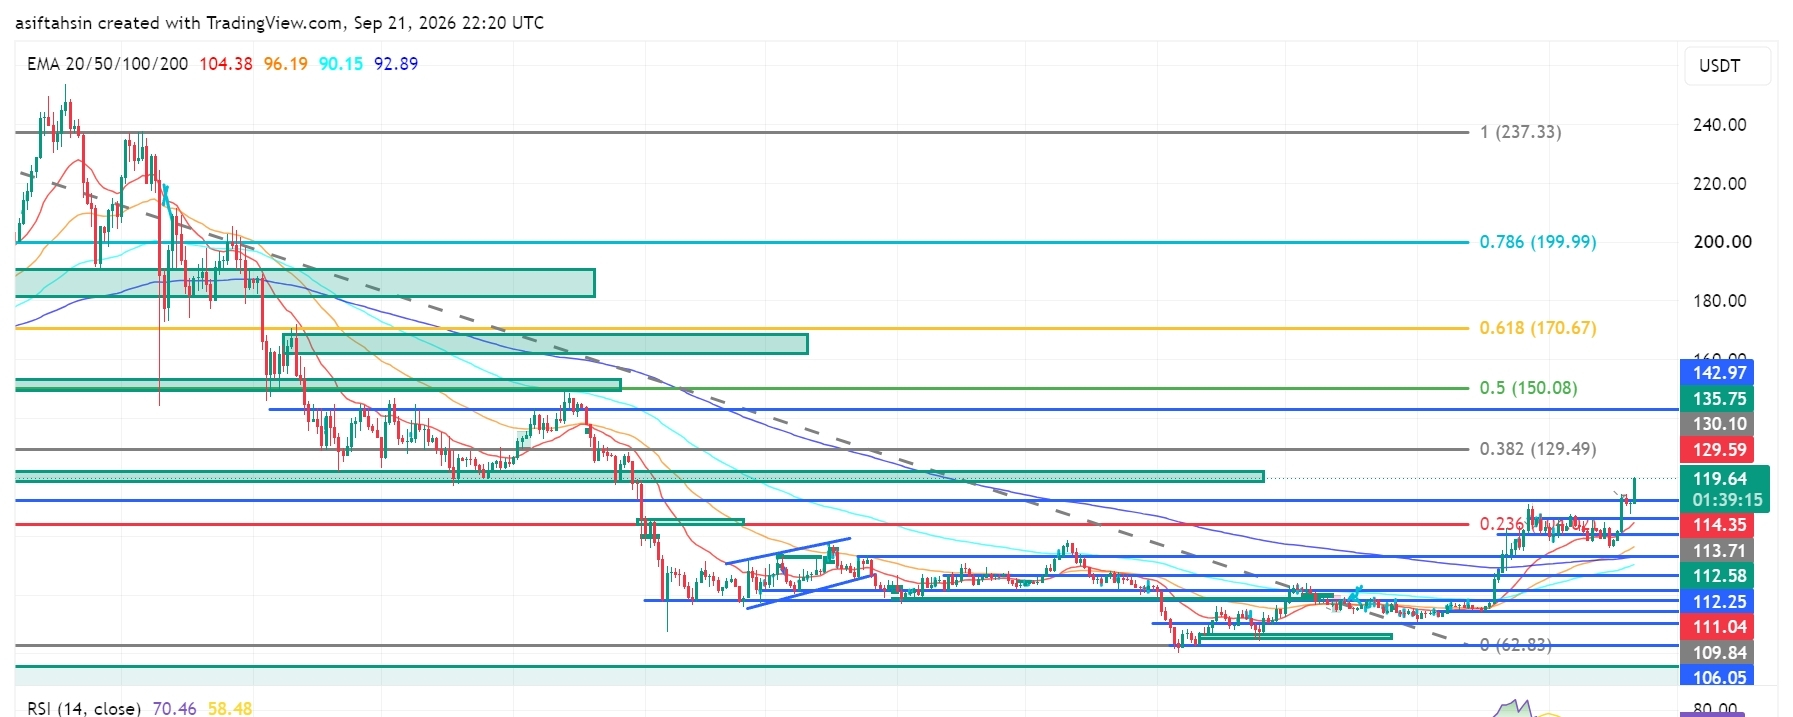

SOL is currently trading around $119.61, holding well above the $112–$114 region after a strong recovery from the $104–$110 support zone.
The broader structure has improved significantly, with SOL reclaiming the $110–$114 area and now testing the $119–$120 resistance zone. A sustained breakout above this region would bring the higher Fibonacci levels back into focus.
📈 EMA Structure
20 EMA: $104.38
50 EMA: $96.19
100 EMA: $90.15
200 EMA: $92.89
SOL is trading significantly above all four major EMAs.
The 20 EMA remains above the 50 EMA, while the 50 EMA is also above the 200 EMA. This alignment reflects a strong recovery structure and improving medium-term trend.
The $104–$106 region is now an important deeper support zone, while the $110–$114 area has developed into a key structural support region after the recent breakout.
📐 Fibonacci Levels
0.236: $114.35
0.382: $129.49
0.5: $150.08
0.618: $170.67
0.786: $199.99
1.0: $237.33
SOL has reclaimed the 0.236 Fibonacci level around $114.35 and is now trading above it.
The next major Fibonacci resistance is $129.49, followed by $150.08.
🟢 Bullish Scenario
Immediate resistance is around:
$119.61 → $120
A clean breakout and sustained close above the $119–$120 zone could open the path toward:
$129.49 → $135.75 → $142.97 → $150.08
The $129.49 level is the next major Fibonacci resistance. A successful breakout and retest above $129.49 would strengthen the continuation structure and put the $150.08 level into focus.
Above $150.08, the higher Fibonacci references are:
$170.67 → $199.99 → $237.33
🔴 Pullback Scenario
Key support levels:
$114.35
$113.71
$112.58
$112.25
$111.04
$109.84
$106.05
$104.38
$96.19
$92.89
$90.15
The $111–$114 zone is particularly important.
A pullback into this area followed by a successful hold would keep the breakout structure constructive. Losing $109.84–$106.05 would indicate deeper consolidation, while a sustained move below the $104.38 20 EMA would significantly weaken the current recovery structure.
🧠 Market Structure & Liquidity
Liquidity Sweep → Accumulation → Higher Lows → Breakout → Expansion → Retest → Consolidation → Continuation
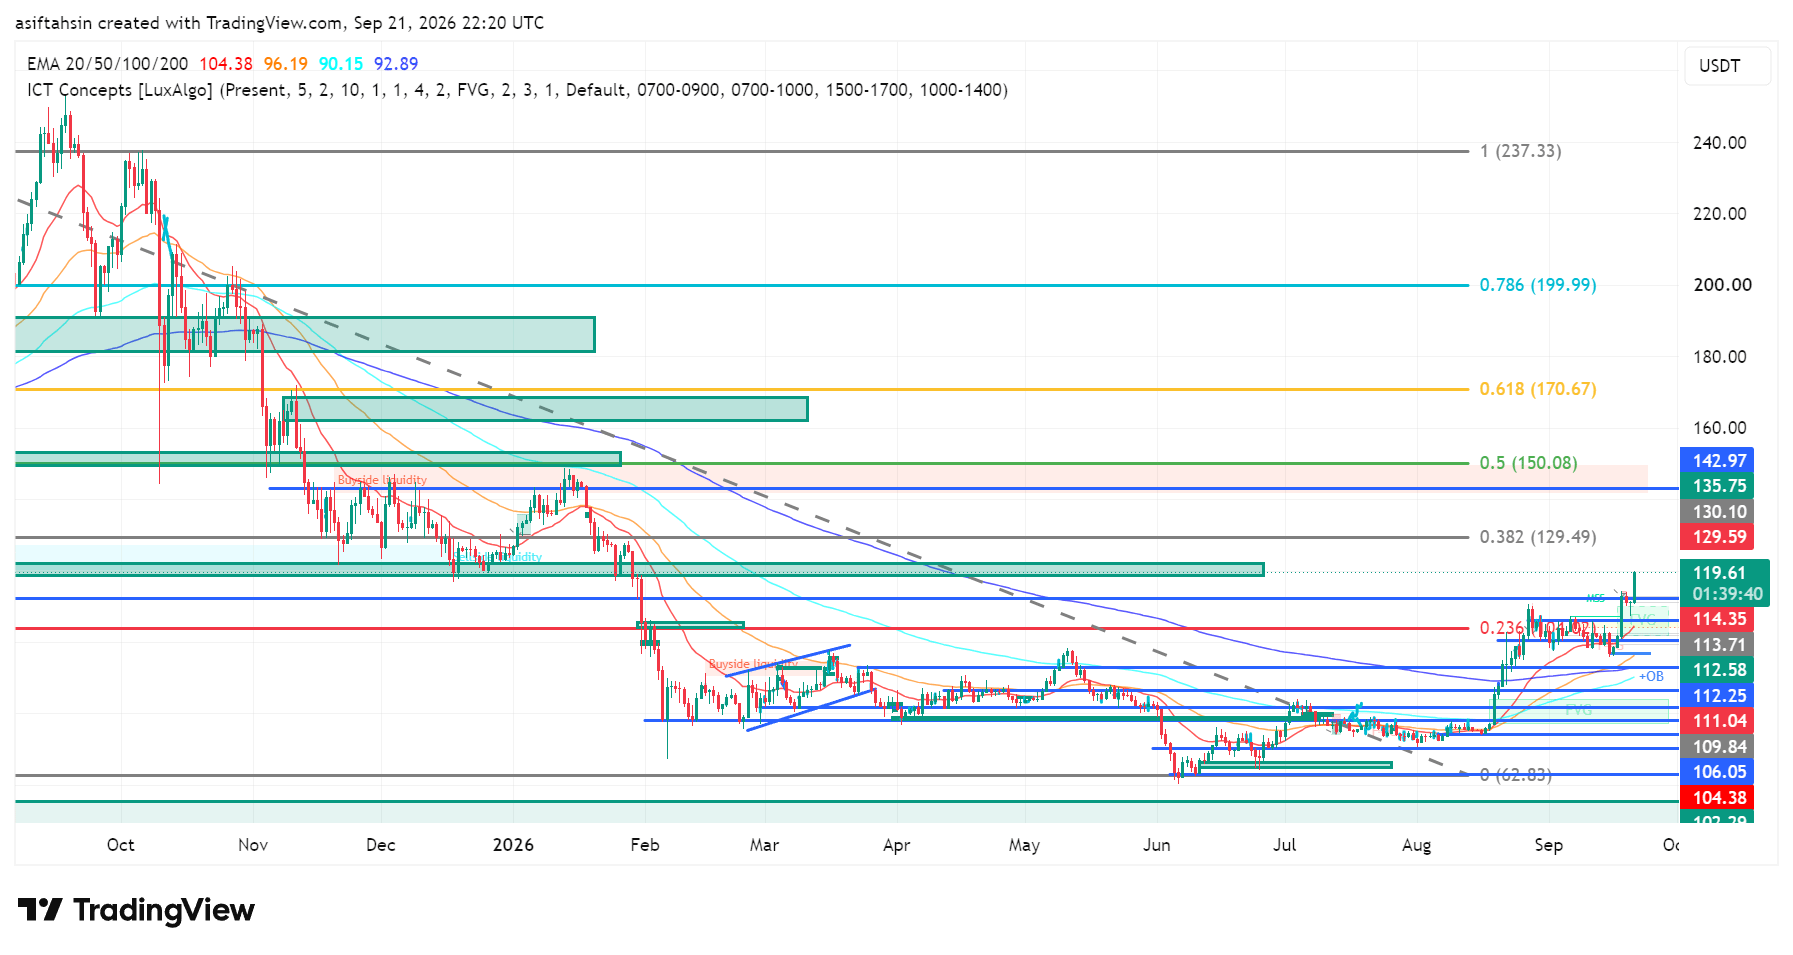
SOL has moved through several important structural phases, recovering from the June low around $62.83, building higher lows, reclaiming the $100 area, and then breaking above the previous $110–$114 resistance region.
The current move toward $120 represents another expansion phase, with $119–$120 acting as the immediate decision zone.
📊 RSI Momentum
RSI: 70.46
RSI MA: 58.48
RSI has moved above 70, showing strong bullish momentum but also entering an overbought region.
This does not automatically mean a reversal. However, after the recent expansion, SOL could experience short-term consolidation or a pullback before attempting another leg higher.
The key will be whether RSI can remain elevated while price holds the $114–$119 structure.
🎯 Key Levels
Resistance:
$119.61 → $120 → $129.49 → $135.75 → $142.97 → $150.08 → $170.67 → $199.99
Support:
$114.35 → $113.71 → $112.58 → $112.25 → $111.04 → $109.84 → $106.05 → $104.38
Major EMA Support:
$104.38 / $96.19 / $92.89 / $90.15
📌 Final Outlook
SOL has strengthened considerably after reclaiming the $110–$114 region and pushing toward $120.
The key battle now is $119–$120.
A sustained breakout above this zone could open the path toward $129.49, followed by $135.75–$142.97 and the major $150.08 Fibonacci level.
On the downside, $111–$114 is the first major retest zone. Holding this area would keep the breakout structure intact, while a deeper move below $106.05–$104.38 would weaken the current setup.
Bias: Recovery structure remains strong above $104.38. A sustained breakout above $119–$120 could open the path toward $129.49, with $150.08 as the next major Fibonacci objective.
