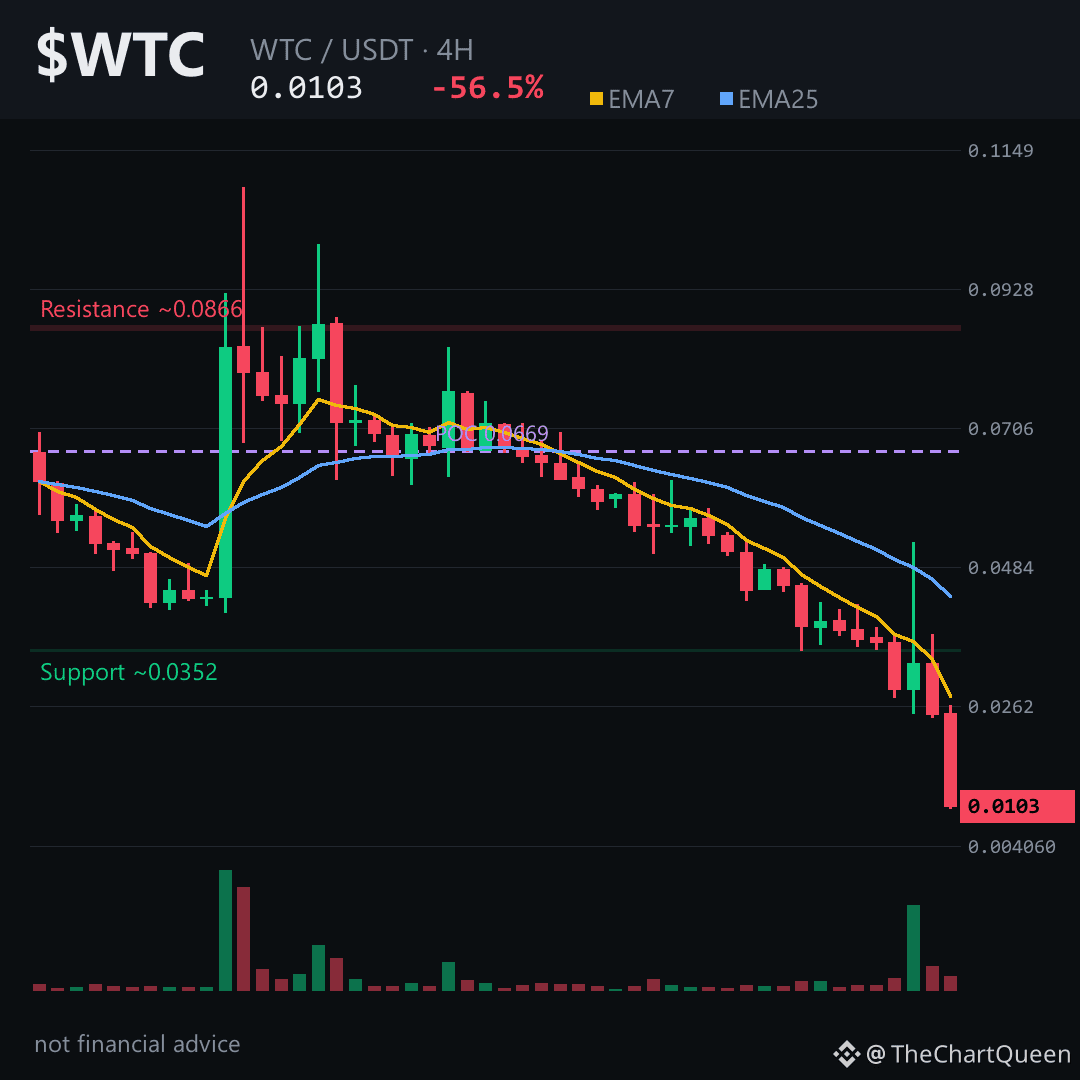
What does a 56% single-day drop actually leave behind for $WTC?
Most of the time, a candle like that isn't the finish line — it's the market repricing everything at once, and the real story is where price settles afterward.
Right now, that story is being written just above the 0.010 area — the last place buyers showed real interest in the past 24 hours.
The 4H picture is the cleanest read. Price is at roughly 0.0103, and the structure is leaning bearish. Short-term moving averages are stacked with the faster line collapsed far below the slower one — momentum isn't just weak, it's broken.
RSI is near 20, deep in oversold territory. That doesn't guarantee a bounce — in a strong downtrend, oversold can stay oversold. It just tells you the selling has been aggressive and unrelenting.
There's also an unfilled daily gap between roughly 0.054 and 0.058 — a pocket where very little trading happened, and markets often drift back toward those zones eventually. But that's a story for later, not a reason to fight the current trend.
For now, the level that matters most is the 0.0109 area. If $WTC can't reclaim that on a 4H close, the path of least resistance points toward 0.0094 — the next real pocket of interest.
My read: this is a falling knife that hasn't found a floor yet — structure says lower, but the oversold reading means the risk of a violent snap-back is real. Respect the zone, not the hype.
Tap $WTC to pull up the chart and see how price reacts to that 0.0109 area.
What level are you watching for a possible floor here? 👇
Follow for the next read on this chart.
⚠️ Not financial advice. DYOR.
#WTC #Crypto #BinanceSquare #Altcoins
Most of the time, a candle like that isn't the finish line — it's the market repricing everything at once, and the real story is where price settles afterward.
Right now, that story is being written just above the 0.010 area — the last place buyers showed real interest in the past 24 hours.
The 4H picture is the cleanest read. Price is at roughly 0.0103, and the structure is leaning bearish. Short-term moving averages are stacked with the faster line collapsed far below the slower one — momentum isn't just weak, it's broken.
RSI is near 20, deep in oversold territory. That doesn't guarantee a bounce — in a strong downtrend, oversold can stay oversold. It just tells you the selling has been aggressive and unrelenting.
There's also an unfilled daily gap between roughly 0.054 and 0.058 — a pocket where very little trading happened, and markets often drift back toward those zones eventually. But that's a story for later, not a reason to fight the current trend.
For now, the level that matters most is the 0.0109 area. If $WTC can't reclaim that on a 4H close, the path of least resistance points toward 0.0094 — the next real pocket of interest.
My read: this is a falling knife that hasn't found a floor yet — structure says lower, but the oversold reading means the risk of a violent snap-back is real. Respect the zone, not the hype.
Tap $WTC to pull up the chart and see how price reacts to that 0.0109 area.
What level are you watching for a possible floor here? 👇
Follow for the next read on this chart.
⚠️ Not financial advice. DYOR.
#WTC #Crypto #BinanceSquare #Altcoins