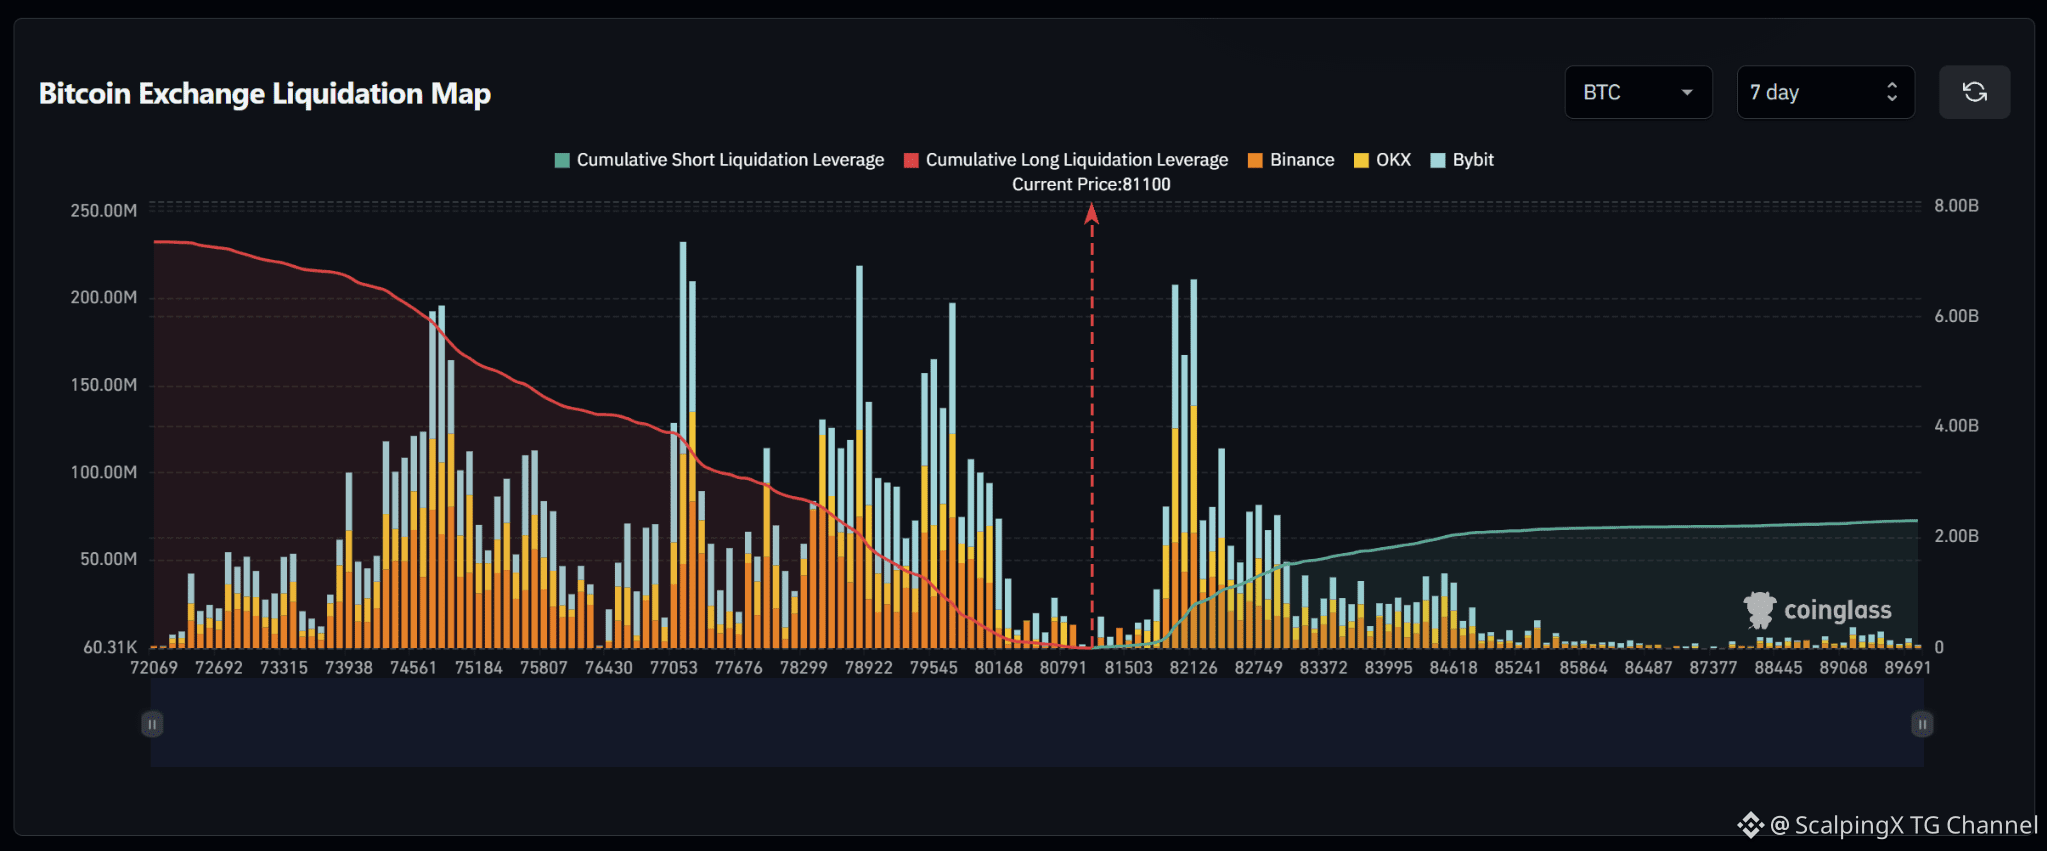
$BTC – Liquidation Map (7 Days) – Current Price 81,100 🔎 The 7-day liquidation map shows roughly $7.1–7.3 billion in long liquidations below the current price, far exceeding approximately $2.1–2.2 billion in short liquidations above. The liquidity structure therefore strongly favors the downside, with more than three times as much cumulative liquidity below the market. 📉 Below the market, long-liquidation liquidity is concentrated heavily across 74,000–80,000. The strongest clusters sit around 77,000–77,500 with a bar above $230 million, around 78,700–79,100 with a bar near $215 million, and around 79,400–79,800 with a bar close to $200 million. Losing 80,700 would shift attention toward 80,100–79,500 and then 78,900–78,300. 📈 Above the market, the nearest short-liquidation cluster is concentrated heavily around 81,800–82,300, where the largest bars reach roughly $200–210 million. Beyond that zone, liquidity thins quickly; 82,700–84,600 still holds several pockets, but most are only around $30–80 million, while liquidity above 85,000 is comparatively sparse. 🧭 The broader setup still favors the downside because long-liquidation exposure below is more than three times larger. Losing 80,700 would increase the probability of a sweep toward 80,100–79,500, followed by 78,900–78,300. Breaking above 81,800 would instead expose 82,100–82,300 before price enters a much thinner liquidity field higher up.

Posting