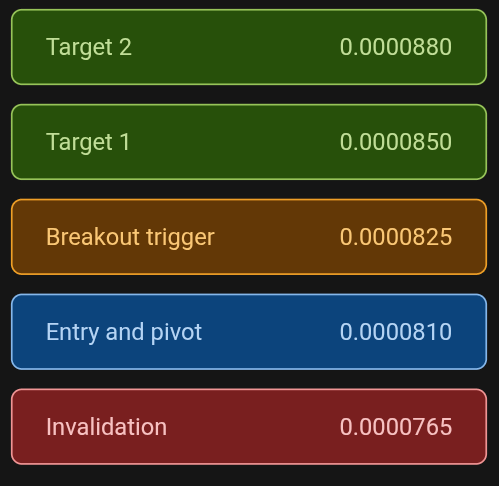

📍 **Entry:** 0.0000810 ⚡
🎯 **Target 1:** 0.0000850 🚀
🎯 **Target 2:** 0.0000880 💎
🛑 **Invalidation:** below 0.0000765 ⚠️
**What just happened?** 🧐
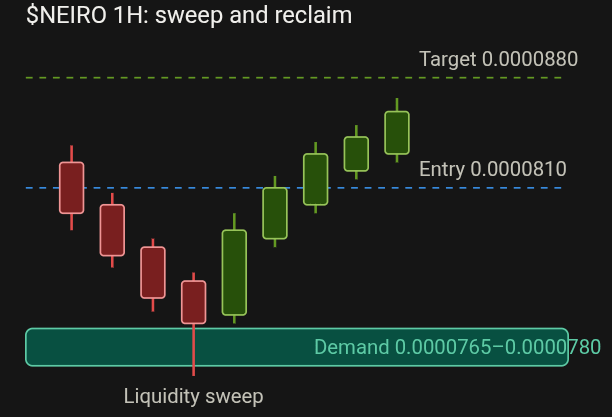
Price dipped into the demand zone at 0.0000765–0.0000780 and swept the sell-side liquidity resting below it. Buyers stepped in right away, and price pushed back above 0.0000800. That kind of sharp rejection often means weak hands were shaken out. 🦈
**Market structure** 📊
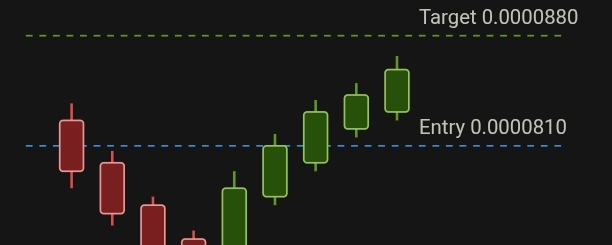
On the 1H chart, price is printing higher highs and higher lows, a bullish structure shift. Volume has picked up on the green candles and faded on the pullbacks, which suggests buyers are in control for now. 📈
**Key levels to watch** 🔍
🔹 **0.0000810:** the pivot. Holding above it keeps the bullish bias intact.
🔹 **0.0000825:** the breakout trigger. A strong candle close above it could open the way to 0.0000880.
🔹 **0.0000765:** the last defense. Losing it breaks the structure.
**Trading plan** 🧠
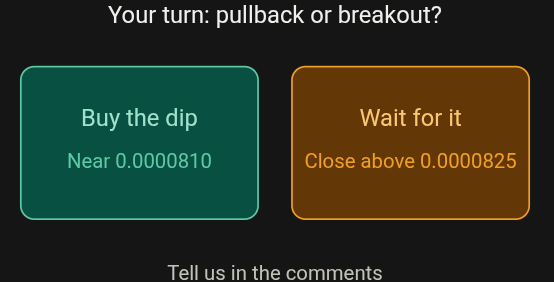
✅ Aggressive traders can look for entries on a retest of 0.0000810.
✅ Conservative traders can wait for a confirmed 1H close above 0.0000825.
✅ Take partial profits at each target and move your stop-loss up to protect gains. 💰
**Risk management** 🛡️
Meme coins move fast in both directions. Never risk more than 1–2% of your capital on one trade, always use a stop-loss, and don't chase green candles. 🎢
💬 **Your turn:** Are you buying this pullback or waiting for the breakout above 0.0000825? Tell me in the comments! 👇
⚠️ *Not financial advice. Do your own research and manage your risk.*