
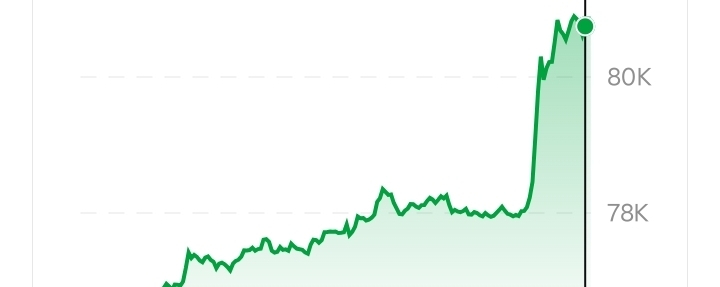

Bitcoin is currently trading around $80,864, after a strong move higher today. BTC has traded as high as approximately $80,944, while the intraday low is around $76,205.
The latest price action shows strong buying interest, but Bitcoin is also approaching an important resistance area. This makes the next few candles particularly important for traders.
🕯️ What Is the Current Candle Telling Us?
The latest price action shows a strong bullish move from the mid-$76K area toward the $80K zone.
A large bullish candle generally indicates that buyers are currently stronger than sellers during that period. However, one candle alone cannot confirm a long-term trend.
Traders should watch:
Candle + Volume + Support/Resistance + Momentum
rather than relying on the candle alone.
📊 Key Support Levels
Important areas to watch include:
🔹 $79,500–$80,000 — immediate breakout/retest zone
🔹 $76,000–$75,000 — important short-term support
🔹 $73,800 area — deeper technical support
Recent technical analysis has highlighted approximately $75,000 as an important support area. A sustained move below this zone would weaken the current bullish structure.
🚀 Key Resistance Levels
Bitcoin is now testing an important resistance region around:
🔸 $80,000–$80,900 — current resistance area
🔸 $82,000–$82,200 — next potential technical target
🔸 $85,000 — higher resistance/target zone
A clean breakout should ideally be supported by strong trading volume and a candle close above resistance.
📈 Bullish Scenario
If Bitcoin produces a strong candle close above the $80K–$81K region and successfully holds that area as support, traders may watch the next zones around $82K and potentially $85K.
The key point is confirmation.
A quick move above resistance followed by a rejection is different from a sustained breakout.
📉 Bearish Scenario
If BTC is rejected from the current resistance zone and falls below $75K–$76K, the market could enter another correction.
A break below major support would make lower levels increasingly important, including the area around $73.8K.
This does not mean Bitcoin must fall; it simply identifies levels traders may monitor if selling pressure increases.
🧠 RSI & Momentum
Momentum indicators should be watched alongside the candles.
Recent analysis has shown that Bitcoin's short-term momentum can become overheated after a sharp rally. One recent report noted hourly RSI moving into overbought territory while BTC was near resistance.
An overbought RSI does not automatically mean “sell.”
It means price has moved strongly and traders should watch for either:
✅ continued momentum
or
⚠️ a pullback/consolidation.
📦 Volume Is Important
A breakout with increasing volume is generally more convincing than a breakout occurring on weak volume.
For example:
Price ↑ + Volume ↑ = stronger confirmation
while:
Price ↑ + Volume ↓ = breakout needs more caution
Volume should therefore be checked whenever Bitcoin approaches major resistance.
🕯️ Candlestick Signals to Watch
Bullish Signal
A strong bullish candle closes above resistance and the following candle holds the breakout level.
Bearish Rejection
Price moves above resistance but closes back below it with a noticeable upper wick.
Doji
A doji can show indecision between buyers and sellers.
Bullish Engulfing
A large bullish candle completely covers the previous smaller bearish candle and can indicate increasing buying pressure.
Bearish Engulfing
A large bearish candle covers the previous bullish candle and can indicate increasing selling pressure.
Remember: no candlestick pattern guarantees the next price movement.
🔮 Bitcoin Price Outlook
Instead of giving one guaranteed prediction, traders can consider different scenarios.
Bullish scenario:
BTC holds above $80K → breakout confirmation → $82K → $85K area becomes important.
Sideways scenario:
BTC remains between approximately $75K and $81K while buyers and sellers fight for control.
Bearish scenario:
BTC loses $75K–$76K support → deeper correction becomes possible.
These are technical scenarios, not guaranteed price predictions.
🔥 What Should Traders Watch Next?
The most important things to monitor are:
Daily candle close
$80K–$81K resistance
$75K–$76K support
Trading volume
RSI momentum
MACD direction
Bitcoin dominance
Overall crypto market sentiment
ETF/institutional flows
Major global economic and central-bank news
⚠️ Risk Management
Bitcoin can move thousands of dollars in a short period.
Never assume that a green candle means the price must continue rising.
Before entering a trade, consider:
• Entry price
• Stop-loss level
• Take-profit levels
• Position size
• Trading fees
• Your personal risk tolerance
Never trade with money you cannot afford to lose.
🎯 Final Takeaway
Bitcoin's current structure is being tested around the $80K–$81K resistance area after today's strong move.
The next important question is not simply:
“Will Bitcoin go up?”
The better question is:
“Can Bitcoin break resistance and hold it as support?”
A confirmed breakout, strong volume and successful retest would provide stronger technical evidence than a temporary move above resistance.
On the other hand, rejection from resistance followed by a loss of major support would indicate that traders should pay closer attention to downside levels.
Watch the candle. Watch the volume. Respect the support and resistance. Manage your risk.
#Bitcoin #BTC #Crypto #Binance #BitcoinAnalysis #BTCUSDT #CryptoTrading #TechnicalAnalysis #Candlestick #BitcoinPrice ck Analysis — September 18, 2026
Bitcoin is currently trading around $80,864, after a strong move higher today. BTC has traded as high as approximately $80,944, while the intraday low is around $76,205.
The latest price action shows strong buying interest, but Bitcoin is also approaching an important resistance area. This makes the next few candles particularly important for traders.
🕯️ What Is the Current Candle Telling Us?
The latest price action shows a strong bullish move from the mid-$76K area toward the $80K zone.
A large bullish candle generally indicates that buyers are currently stronger than sellers during that period. However, one candle alone cannot confirm a long-term trend.
Traders should watch:
Candle + Volume + Support/Resistance + Momentum
rather than relying on the candle alone.
📊 Key Support Levels
Important areas to watch include:
🔹 $79,500–$80,000 — immediate breakout/retest zone
🔹 $76,000–$75,000 — important short-term support
🔹 $73,800 area — deeper technical support
Recent technical analysis has highlighted approximately $75,000 as an important support area. A sustained move below this zone would weaken the current bullish structure.
🚀 Key Resistance Levels
Bitcoin is now testing an important resistance region around:
🔸 $80,000–$80,900 — current resistance area
🔸 $82,000–$82,200 — next potential technical target
🔸 $85,000 — higher resistance/target zone
A clean breakout should ideally be supported by strong trading volume and a candle close above resistance.
📈 Bullish Scenario
If Bitcoin produces a strong candle close above the $80K–$81K region and successfully holds that area as support, traders may watch the next zones around $82K and potentially $85K.
The key point is confirmation.
A quick move above resistance followed by a rejection is different from a sustained breakout.
📉 Bearish Scenario
If BTC is rejected from the current resistance zone and falls below $75K–$76K, the market could enter another correction.
A break below major support would make lower levels increasingly important, including the area around $73.8K.
This does not mean Bitcoin must fall; it simply identifies levels traders may monitor if selling pressure increases.
🧠 RSI & Momentum
Momentum indicators should be watched alongside the candles.
Recent analysis has shown that Bitcoin's short-term momentum can become overheated after a sharp rally. One recent report noted hourly RSI moving into overbought territory while BTC was near resistance.
An overbought RSI does not automatically mean “sell.”
It means price has moved strongly and traders should watch for either:
✅ continued momentum
or
⚠️ a pullback/consolidation.
📦 Volume Is Important
A breakout with increasing volume is generally more convincing than a breakout occurring on weak volume.
For example:
Price ↑ + Volume ↑ = stronger confirmation
while:
Price ↑ + Volume ↓ = breakout needs more caution
Volume should therefore be checked whenever Bitcoin approaches major resistance.
🕯️ Candlestick Signals to Watch
Bullish Signal
A strong bullish candle closes above resistance and the following candle holds the breakout level.
Bearish Rejection
Price moves above resistance but closes back below it with a noticeable upper wick.
Doji
A doji can show indecision between buyers and sellers.
Bullish Engulfing
A large bullish candle completely covers the previous smaller bearish candle and can indicate increasing buying pressure.
Bearish Engulfing
A large bearish candle covers the previous bullish candle and can indicate increasing selling pressure.
Remember: no candlestick pattern guarantees the next price movement.
🔮 Bitcoin Price Outlook
Instead of giving one guaranteed prediction, traders can consider different scenarios.
Bullish scenario:
BTC holds above $80K → breakout confirmation → $82K → $85K area becomes important.
Sideways scenario:
BTC remains between approximately $75K and $81K while buyers and sellers fight for control.
Bearish scenario:
BTC loses $75K–$76K support → deeper correction becomes possible.
These are technical scenarios, not guaranteed price predictions.
🔥 What Should Traders Watch Next?
The most important things to monitor are:
Daily candle close
$80K–$81K resistance
$75K–$76K support
Trading volume
RSI momentum
MACD direction
Bitcoin dominance
Overall crypto market sentiment
ETF/institutional flows
Major global economic and central-bank news
⚠️ Risk Management
Bitcoin can move thousands of dollars in a short period.
Never assume that a green candle means the price must continue rising.
Before entering a trade, consider:
• Entry price
• Stop-loss level
• Take-profit levels
• Position size
• Trading fees
• Your personal risk tolerance
Never trade with money you cannot afford to lose.
🎯 Final Takeaway
Bitcoin's current structure is being tested around the $80K–$81K resistance area after today's strong move.
The next important question is not simply:
“Will Bitcoin go up?”
The better question is:
“Can Bitcoin break resistance and hold it as support?”
A confirmed breakout, strong volume and successful retest would provide stronger technical evidence than a temporary move above resistance.
On the other hand, rejection from resistance followed by a loss of major support would indicate that traders should pay closer attention to downside levels.
Watch the candle. Watch the volume. Respect the support and resistance. Manage your risk.
#Bitcoin #BTC #Crypto #Binance #BitcoinAnalysis #BTCUSDT #CryptoTrading #TechnicalAnalysis #Candlestick #BitcoinPrice #BTCBreaks80K #BTC走势分析 #BTCBULISH