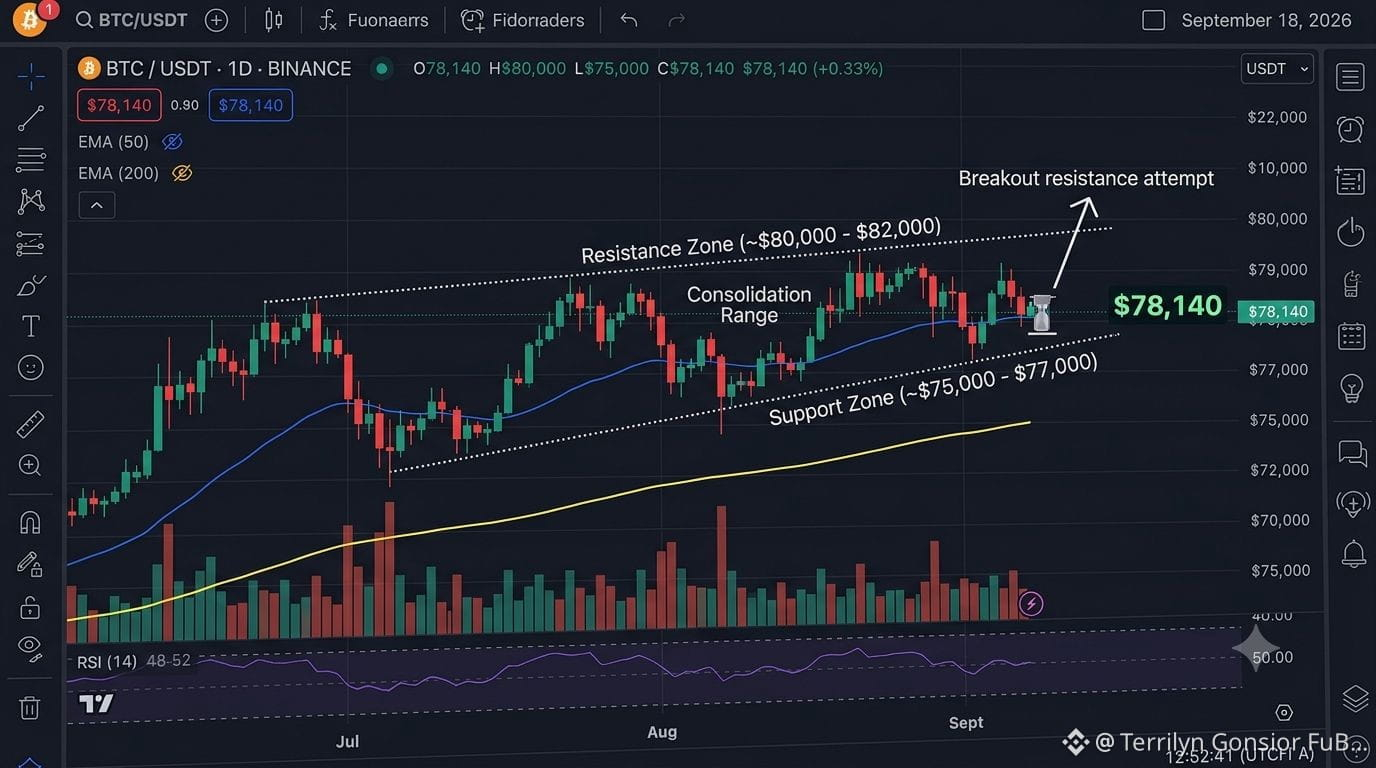
$BTC (BTC/USDT) continues to compress within a defined trading range, hovering around $78,140 as it consolidates between key boundary zones. Over the past few weeks, the market has shown resilient support despite macroeconomic pressures, yet bulls face a heavy ceiling above.
Key Levels to Watch:
🔴 Resistance Zone ($80,000 – $82,000): After multiple rejections near the $80k-$82k threshold since late August, this area remains a critical barrier. A convincing breakout on strong volume is needed to challenge historical highs and push back toward Q4 bullish targets.
🟢 Support Zone ($75,000 – $77,000): Reassuring buyers, BTC has consistently held the mid-$70k level. The 200-day EMA (exponential moving average) and local support trendlines around $75,000 are reinforcing this floor.
📈 Oscillators & Indicators: The daily RSI sits comfortably neutral near 50, reflecting a wait-and-see sentiment following recent Federal Reserve movements. Meanwhile, the 50-day EMA is beginning to flatten, validating the current sideways pattern.
Short-Term Outlook:
A period of tighter consolidation is expected as Bitcoin squeezes inside this channel. If it can clear and maintain a foothold above the 50-day EMA and the $80K psychological resistance, it may pave the path for a strong rally into Q4 2026. Conversely, a drop below $75,000 might invite a test of deeper support.
Disclaimer: This is for educational and informational purposes only and should not be considered financial advice.
Here is a visual breakdown of the current BTC/USDT 1D chart:
#StellarActivatesProtocol28At211TPS #SECGrantsInnovationExemptionForTokenizedStocks #XRPGains3%AsRippleAddsMPPSupport #SPGlobalToAcquireOpenZeppelin
Key Levels to Watch:
🔴 Resistance Zone ($80,000 – $82,000): After multiple rejections near the $80k-$82k threshold since late August, this area remains a critical barrier. A convincing breakout on strong volume is needed to challenge historical highs and push back toward Q4 bullish targets.
🟢 Support Zone ($75,000 – $77,000): Reassuring buyers, BTC has consistently held the mid-$70k level. The 200-day EMA (exponential moving average) and local support trendlines around $75,000 are reinforcing this floor.
📈 Oscillators & Indicators: The daily RSI sits comfortably neutral near 50, reflecting a wait-and-see sentiment following recent Federal Reserve movements. Meanwhile, the 50-day EMA is beginning to flatten, validating the current sideways pattern.
Short-Term Outlook:
A period of tighter consolidation is expected as Bitcoin squeezes inside this channel. If it can clear and maintain a foothold above the 50-day EMA and the $80K psychological resistance, it may pave the path for a strong rally into Q4 2026. Conversely, a drop below $75,000 might invite a test of deeper support.
Disclaimer: This is for educational and informational purposes only and should not be considered financial advice.
Here is a visual breakdown of the current BTC/USDT 1D chart:
#StellarActivatesProtocol28At211TPS #SECGrantsInnovationExemptionForTokenizedStocks #XRPGains3%AsRippleAddsMPPSupport #SPGlobalToAcquireOpenZeppelin