#liquidationmap
🚀 $BTC /USDT Market Analysis: What is the Market Maker Planning?
A very interesting setup is currently forming on the $BTC charts. On one hand, we see solid consolidation; on the other, the liquidation map is practically flashing "appetizing pools" for big players.
📊 What do the metrics show?
Technical picture: The price is squeezed within the $76,000 – $77,200 range. Moving averages (EMA 5/10/30) are tightly coiled—a classic sign of building momentum before a breakout.
Open Interest (OI): Holding at high levels (~108K–109K BTC). Traders continue to build positions in both directions, bracing for a breakout.
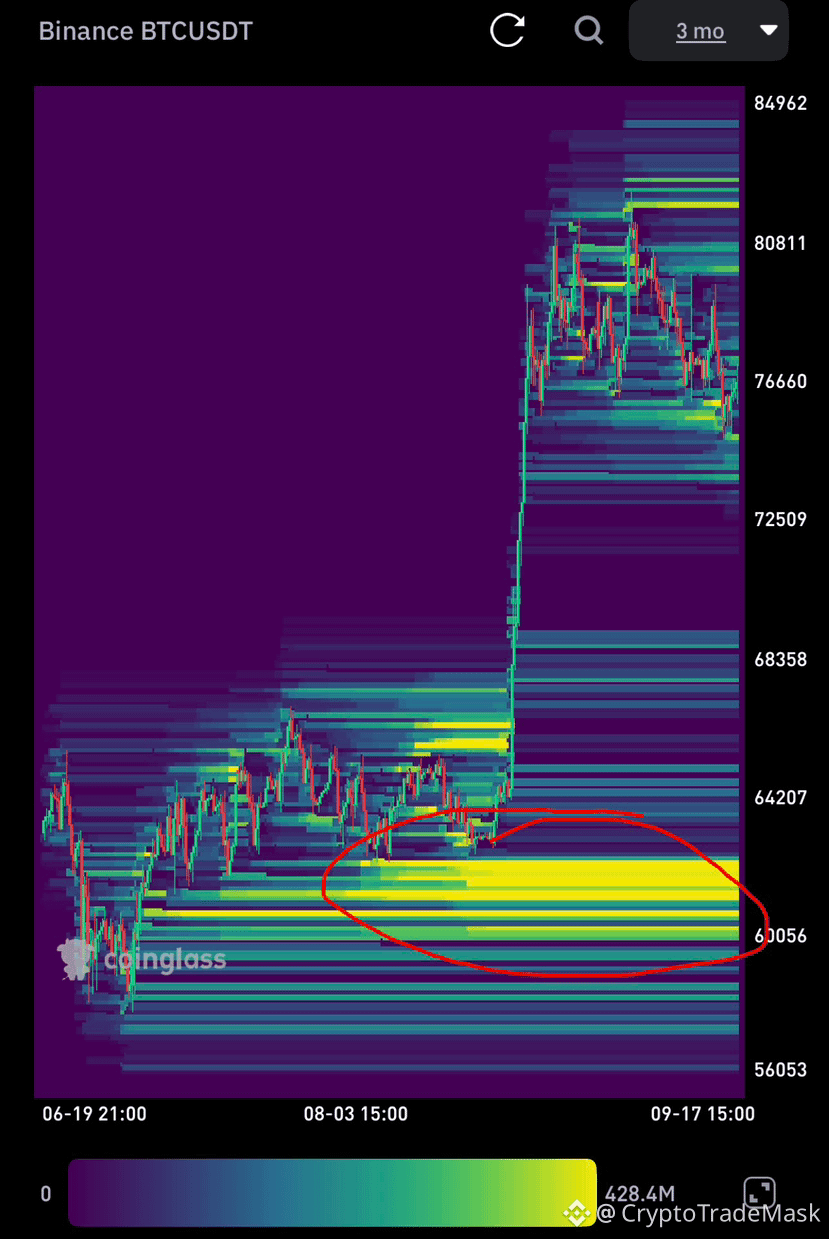
Liquidation Map (Heatmap):
Upside: The $80,000 – $82,000 zone, with a moderate accumulation of short-seller stop-losses.
Downside: A massive "gold mine" cluster at $60,000 – $62,000 (over $400M in liquidity).
🎯 Will the price head toward the lower cluster ($60k)?
Right now—unlikely. A 20% drop requires a powerful fundamental trigger or a cascading sell-off. Market makers prefer the path of least resistance.
Primary scenario:
1. Local liquidity sweep: A quick stop-run in the $74,900 – $75,500 area.
2. Upside breakout: A move to target short positions in the $80,000 – $82,000 range. 3. Global correction: Only after a definitive high is established and retail buyers are lured into long positions at the peak will the market be ready for a deep pullback to the $60,000–$62,000 range.
⚠️ Summary: Do not rush to go "all-in" on a short position expecting $60k right now. Most likely, the market maker will first sweep local highs and only then trigger a massive market flush.
🚀 $BTC /USDT Market Analysis: What is the Market Maker Planning?
A very interesting setup is currently forming on the $BTC charts. On one hand, we see solid consolidation; on the other, the liquidation map is practically flashing "appetizing pools" for big players.
📊 What do the metrics show?
Technical picture: The price is squeezed within the $76,000 – $77,200 range. Moving averages (EMA 5/10/30) are tightly coiled—a classic sign of building momentum before a breakout.
Open Interest (OI): Holding at high levels (~108K–109K BTC). Traders continue to build positions in both directions, bracing for a breakout.
Liquidation Map (Heatmap):
Upside: The $80,000 – $82,000 zone, with a moderate accumulation of short-seller stop-losses.
Downside: A massive "gold mine" cluster at $60,000 – $62,000 (over $400M in liquidity).
🎯 Will the price head toward the lower cluster ($60k)?
Right now—unlikely. A 20% drop requires a powerful fundamental trigger or a cascading sell-off. Market makers prefer the path of least resistance.
Primary scenario:
1. Local liquidity sweep: A quick stop-run in the $74,900 – $75,500 area.
2. Upside breakout: A move to target short positions in the $80,000 – $82,000 range. 3. Global correction: Only after a definitive high is established and retail buyers are lured into long positions at the peak will the market be ready for a deep pullback to the $60,000–$62,000 range.
⚠️ Summary: Do not rush to go "all-in" on a short position expecting $60k right now. Most likely, the market maker will first sweep local highs and only then trigger a massive market flush.