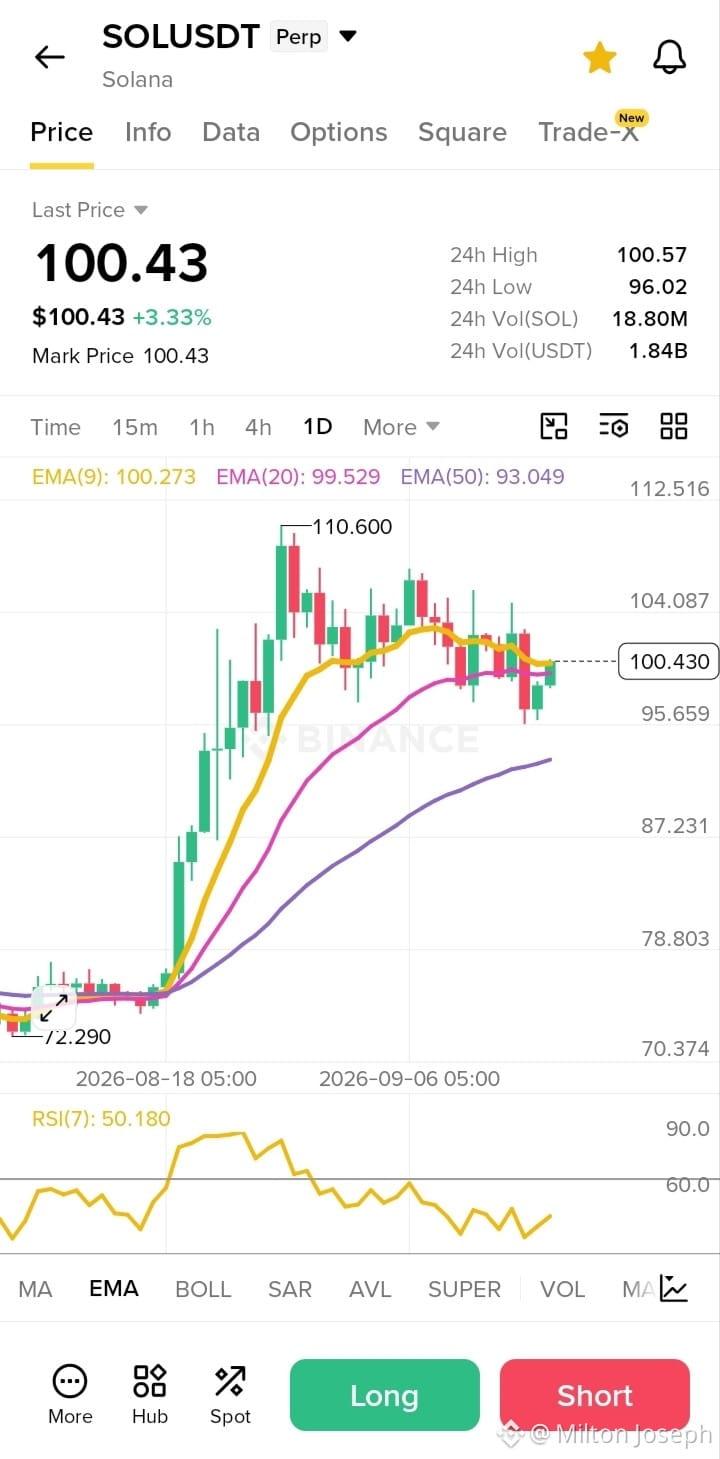
$SOL SOL/USDT (1D Chart) is currently consolidating around the $100 mark, showing neutral momentum with a slight bullish recovery off local support.
Key Technical Observations
Price Action & Trend: After peaking at $110.60, the price pulled back into a consolidation range between ~$95.00 and $104.00. The price is currently at $100.43 (+3.33%).
Exponential Moving Averages (EMAs):
EMA(9) ($100.27): The price is resting right on the 9-period EMA, indicating a short-term inflection point.
EMA(20) ($99.53): Serving as immediate dynamic support just below the current price.
EMA(50) ($93.05): Slanted upward and acting as strong macro support. The overall daily trend remains structurally bullish above this level.
Relative Strength Index - RSI(7) (50.18): Sits right at the neutral 50 level, indicating balanced buying and selling pressure with no immediate overbought or oversold bias.
Key Levels to Watch
Resistance: $104.08 (immediate level) and $110.60 (recent swing high). A daily close above $104.00 could reopen momentum toward testing $110+.
Support: $95.65 (recent swing low support) and $93.05 (EMA 50 confluence). Losing $95.00 could signal a deeper retracement toward $87.00.
Outlook:
The chart is in a neutral-to-slightly-bullish compression phase. Confirmation of a breakout above $104 or a breakdown below $95.50 will likely dictate the next directional move.
Key Technical Observations
Price Action & Trend: After peaking at $110.60, the price pulled back into a consolidation range between ~$95.00 and $104.00. The price is currently at $100.43 (+3.33%).
Exponential Moving Averages (EMAs):
EMA(9) ($100.27): The price is resting right on the 9-period EMA, indicating a short-term inflection point.
EMA(20) ($99.53): Serving as immediate dynamic support just below the current price.
EMA(50) ($93.05): Slanted upward and acting as strong macro support. The overall daily trend remains structurally bullish above this level.
Relative Strength Index - RSI(7) (50.18): Sits right at the neutral 50 level, indicating balanced buying and selling pressure with no immediate overbought or oversold bias.
Key Levels to Watch
Resistance: $104.08 (immediate level) and $110.60 (recent swing high). A daily close above $104.00 could reopen momentum toward testing $110+.
Support: $95.65 (recent swing low support) and $93.05 (EMA 50 confluence). Losing $95.00 could signal a deeper retracement toward $87.00.
Outlook:
The chart is in a neutral-to-slightly-bullish compression phase. Confirmation of a breakout above $104 or a breakdown below $95.50 will likely dictate the next directional move.