

🔥 BRUSDT JUST EXPLODED — +152% IN 24H! 🚀
The $BR


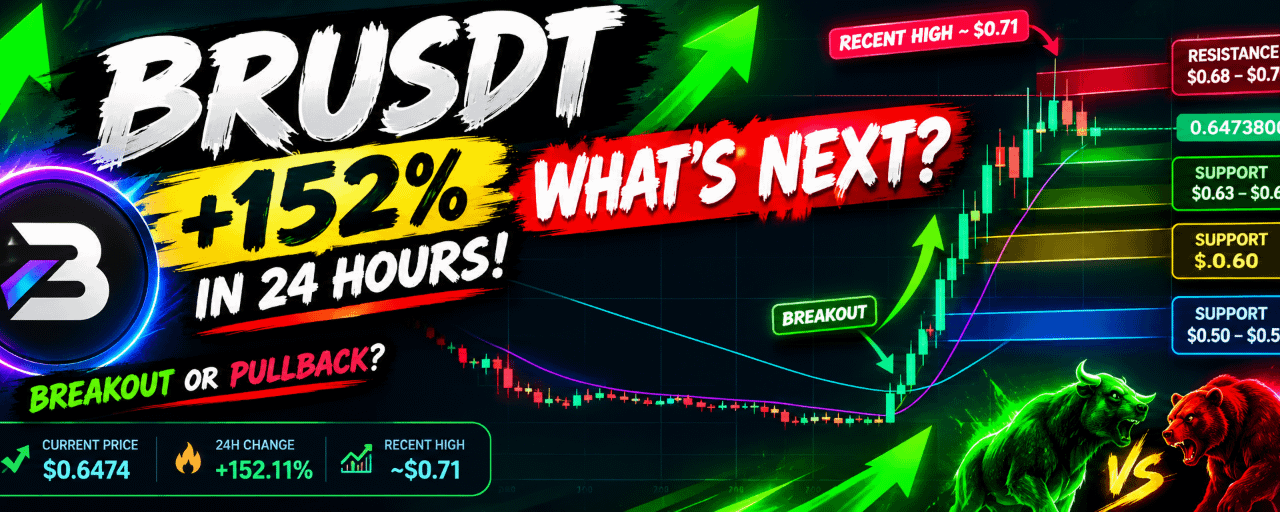
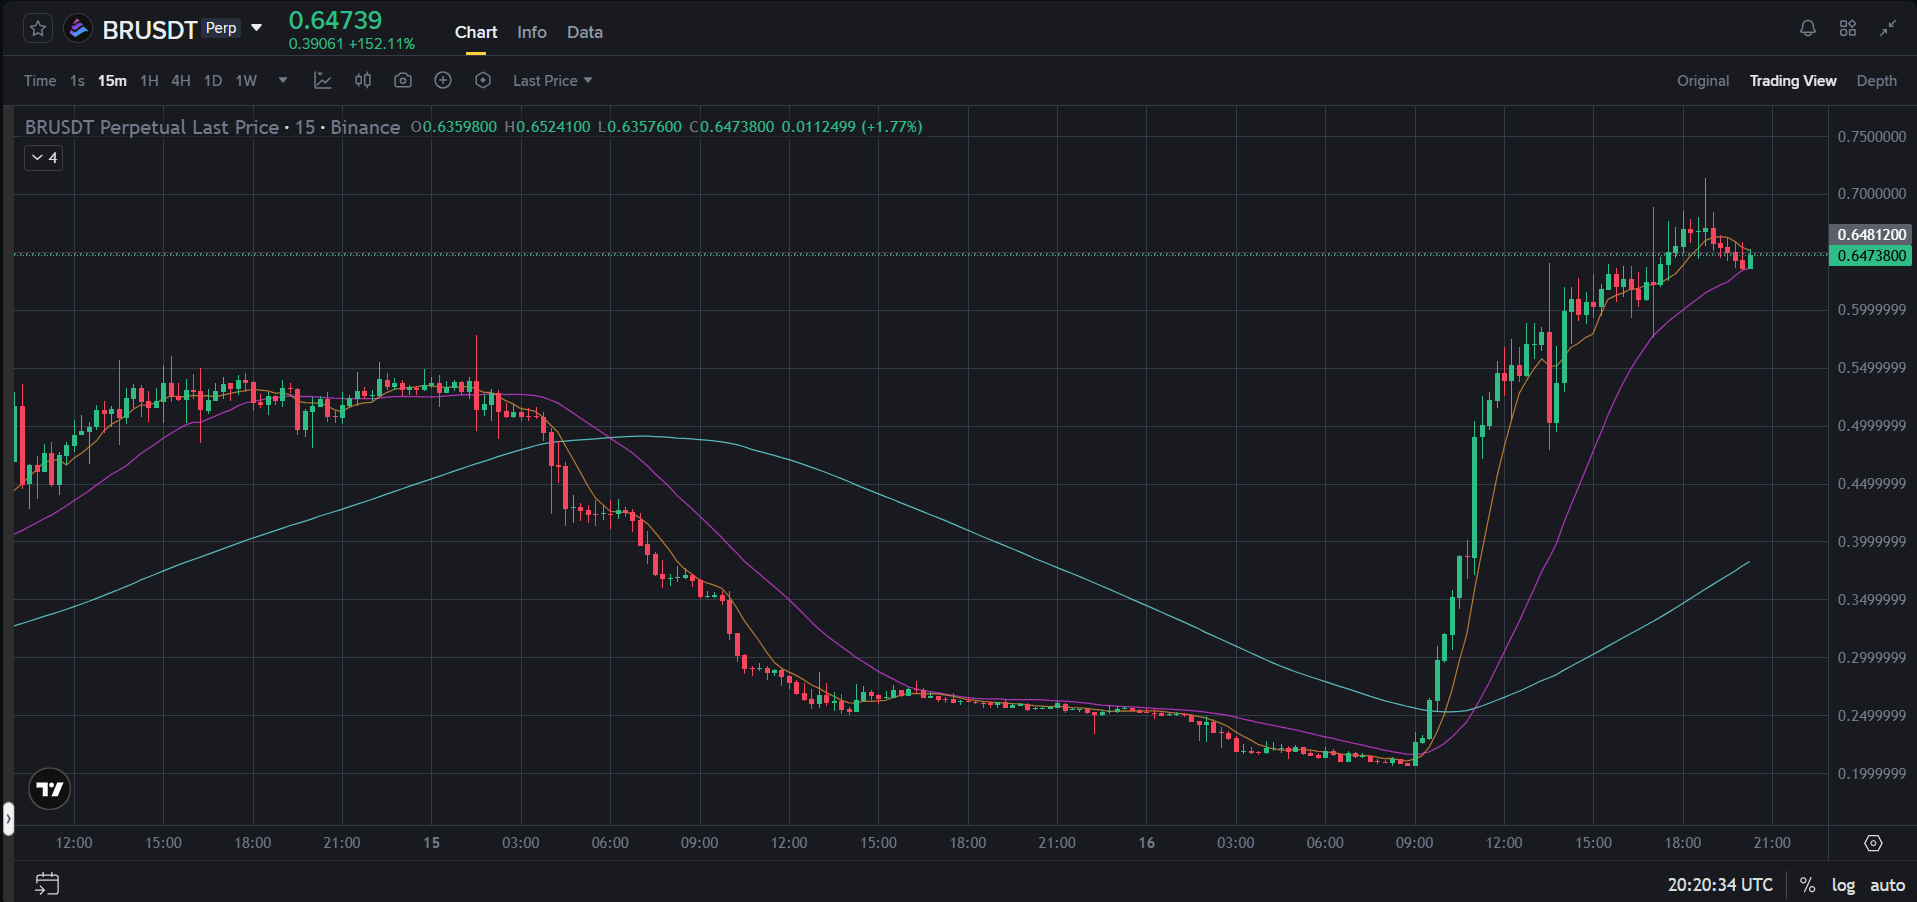
BRUSDT Perpetual 15-minute chart is showing an extremely aggressive momentum move, with price currently around $0.6474 after a massive intraday rally.
The interesting part isn't just the +152% move — it's what price does after such a vertical breakout.
🚨 BRUSDT TECHNICAL BREAKDOWN
📈 1. Massive breakout
BRUSDT spent a long period trading around the $0.20–$0.25 zone before buyers suddenly stepped in.
Price then accelerated through:
➡️ $0.30
➡️ $0.40
➡️ $0.50
➡️ $0.60
This shows a dramatic change in short-term market structure.
🚀 2. Momentum is extremely strong
The screenshot shows:
Current Price: ~$0.6474
24H Change: +152.11%
Recent High: ~$0.71
Price remains well above the longer moving average visible on the chart, indicating that the short-term trend has shifted strongly upward.
However, after a move this large, volatility and profit-taking risk are also elevated.
🎯 KEY LEVELS TO WATCH
🔴 Resistance: $0.68–$0.70
This is the immediate area where sellers could become active.
A sustained move above this zone could put the recent ~$0.71 high back into focus.
🚀 Breakout Zone: ~$0.71
The recent high is an important reference point.
A clean breakout followed by sustained trading above it would be technically different from simply touching the level and getting rejected.
🟡 First Support: $0.63–$0.64
Price is currently hovering around this area.
If buyers defend this zone, the current consolidation could continue.
🟠 Major Support: ~$0.60
The psychological $0.60 level is another important area after the huge rally.
A breakdown below it could indicate that short-term momentum is weakening.
🔵 Deeper Support: ~$0.50–$0.55
This region corresponds roughly with the earlier breakout/acceleration area visible on the chart.
📊 WHAT THE CHART IS SAYING
There are two very different scenarios traders should monitor:
🟢 Bullish scenario
BRUSDT holds around $0.63–$0.64, buyers return, and price pushes toward $0.68–$0.70.
A confirmed move beyond the recent ~$0.71 high would indicate renewed upside momentum.
🔴 Pullback scenario
Price loses the $0.63–$0.64 area and selling pressure increases.
Then $0.60 becomes an important level to watch, followed by the $0.50–$0.55 region.
⚠️ THE BIGGEST RISK
Don't confuse strong momentum with guaranteed continuation.
A coin that has already moved more than 150% in 24 hours can experience very large candles in both directions.
For BRUSDT, traders should especially watch:
🔥 Volume
🔥 15-minute candle closes
🔥 Support/resistance reactions
🔥 Open interest and funding
🔥 Liquidity
🔥 BTC's broader direction
🔥 Whether the breakout above ~$0.71 holds
Chasing a vertical candle can create a very different risk profile from entering after a confirmed consolidation or retest.
👀 MY QUESTION FOR THE BS COMMUNITY
BRUSDT is up more than 150% — what happens next?
🚀 Continuation above $0.71?
📉 Sharp profit-taking?
🦀 Sideways consolidation before the next move?
Drop your BRUSDT target or key level below 👇
Let's see how the community is reading this chart.
⚠️ This is technical-market discussion for educational purposes, not financial advice. Perpetual futures involve significant leverage and liquidation risk. Do your own research and manage risk carefully.
#BR USDT #crypto #cryptotrading #Binance #BinanceSquare #Altcoins #CryptoAnalysis #TechnicalAnalysis #trading #PerpetualFutures #CryptoMarket #Breakout #CryptoNews #BTC #DYOR