


Key Highlights
SOL is trading at $96.58 — down 3.73% in 24 hours — with a $56.7B market cap
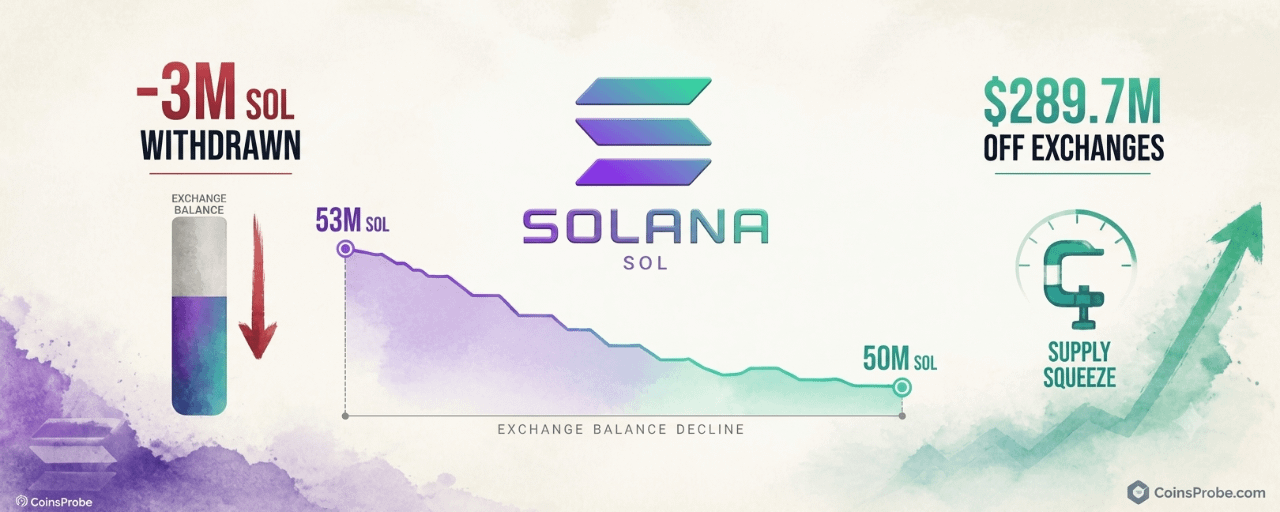
Over 3 million SOL (~$289.7M) withdrawn from exchanges in 30 days, per @alicharts — reducing exchange supply from ~53M to ~50M SOL
Watch SOL exchange balance: below 50M SOL supports squeeze thesis; reversal above 52M invalidates it
Solana is trading at $96.58 — down 3.73% in the past 24 hours — with a market capitalization of $56.7 billion. Beneath the short-term price dip, a structural shift in on-chain supply is quietly building: exchange balances have shed more than 3 million SOL in a single month, compressing the immediately available sell-side inventory at a time when demand signals are strengthening.
This supply contraction is the focus of on-chain analyst Ali Martinez (@alicharts), who flags it as part of a broader thread on Solana’s market structure — specifically post 4/6 in a multi-part analysis. Martinez states directly: “This growing demand aligns with a steady decline in exchange supply. More than 3 million SOL have been withdrawn from exchanges over the past month, reducing the tokens readily available to sell.” The convergence of rising demand and shrinking supply is the classic setup for a supply squeeze — one of the most structurally significant conditions in on-chain analysis.
Signal — SOL Exchange Balance Drops 3 Million Tokens in One Month
Exchange balance is one of the most direct on-chain indicators available. It measures the quantity of a given token held in wallets controlled by centralized exchanges — Binance, Coinbase, OKX, and others. Tokens sitting on exchanges are, by definition, positioned for immediate sale. When those tokens are withdrawn to private wallets or cold storage, they are removed from the liquid sell-side pool.
The mechanism is straightforward: fewer tokens on exchanges means less immediately available supply. If buying demand remains constant or increases while available supply contracts, the path of least resistance for price shifts upward.
What the Chart Shows — August 27 to September 14
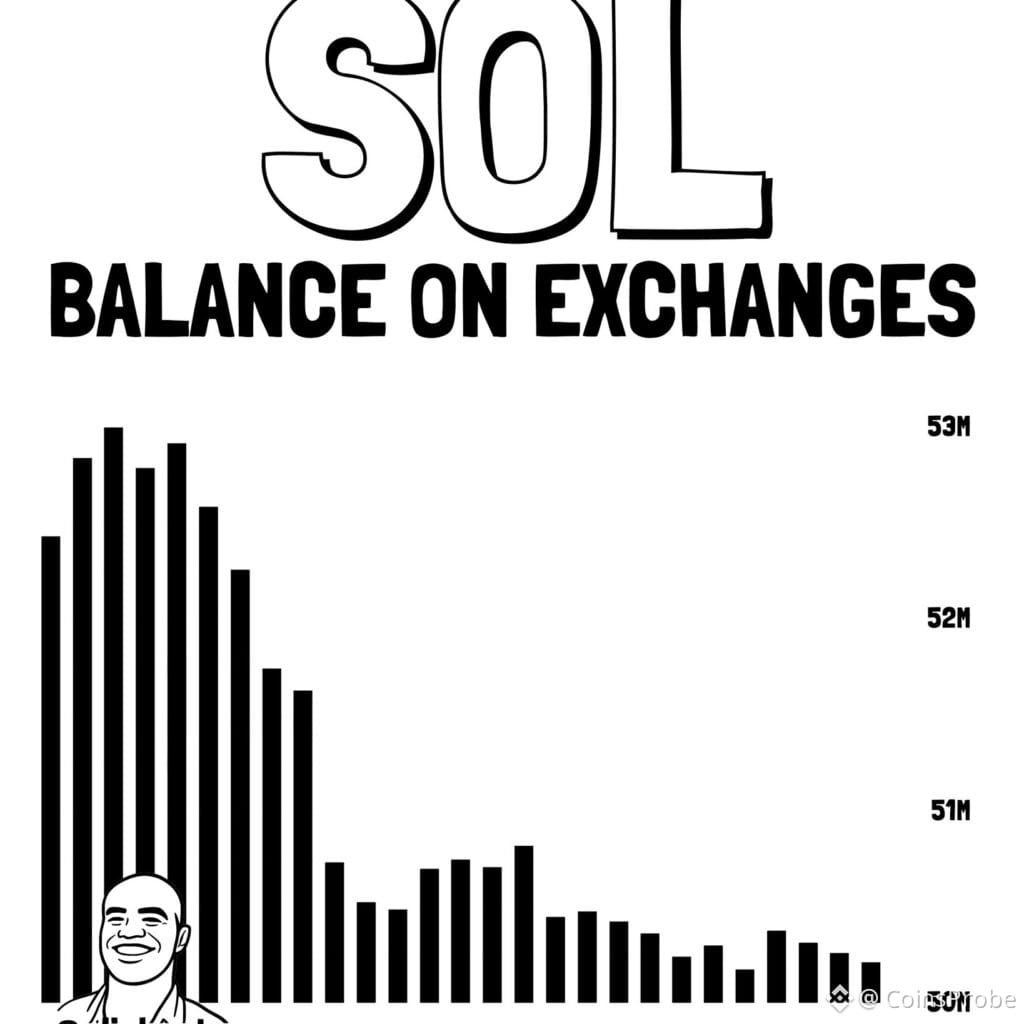
Solana Exchange Supply Drop/ Chart via @alicharts (X)
The exchange balance chart shared by @alicharts covers approximately 18 days from late August through mid-September 2026. The data reveals a consistent, uninterrupted downtrend with no meaningful reversals:
Peak: ~53 million SOL on exchanges (late August)
Current: ~50 million SOL (September 14)
Decline: ~3 million SOL withdrawn — a reduction of approximately 5.7% in exchange-held supply
The drawdown occurred in two distinct phases. The first was a sharp decline from approximately 53 million to 51 million SOL between August 27 and September 1 — a rapid 2 million SOL exit in roughly five days. The second phase was a more gradual continued decline from 51 million to 50 million through mid-September. The absence of any meaningful reversal throughout this period is notable: this is not noise around a flat trend. It is a directional move.
Period Exchange Balance Change Late August (peak)~53M SOL—Sep 1 (phase 1 end)~51M SOL−2M SOL Sep 14 (current)~50M SOL−1M SOL additional Total decline—−3M SOL (−5.7%)
SOL Exchange Balance — Aug 27 to Sep 14, 2026 | Source: @alicharts (X)
Why Exchange Withdrawals Signal Accumulation Intent
When holders withdraw tokens from exchanges, they are making a deliberate choice to move assets out of the immediate sell queue. The dominant reasons for such withdrawals are cold storage (long-term holding) and staking. Both represent the same behavioral signal: the holder does not intend to sell in the near term.
At Solana’s current price of $96.58, 3 million SOL represents approximately $289.7 million in notional value removed from the liquid sell pool over 30 days. That is not a rounding error. At current 24-hour trading volume of $3.9 billion, that figure represents roughly 7.4% of a single day’s volume in supply permanently shifted off exchanges.
The behavioral interpretation: participants holding nearly $290 million in SOL have collectively decided the current price range does not warrant selling. This is the operational definition of accumulation — not in the loose marketing sense, but in the specific on-chain sense of supply being removed from immediately accessible sell-side inventory. This dynamic is also consistent with what on-chain analysts have tracked in Bitcoin’s recent bull score re-entry, where exchange outflows accompanied the regime shift.
What the Data Says — And What It Doesn’t
What it says: 3 million SOL — approximately $289.7 million in value — has been removed from immediate sell-side availability over 30 days. The trend is consistent, directional, and accelerating into mid-September. Combined with Martinez’s broader thread citing growing demand signals, this is a structurally bullish supply dynamic.
What it doesn’t say: Exchange outflows alone do not guarantee price appreciation. A holder who withdraws SOL to cold storage can re-deposit it to an exchange within hours. The signal measures intent at the moment of withdrawal — it does not lock in future behavior. Additionally, if macro conditions deteriorate sharply, even reduced exchange supply cannot absorb a demand collapse.
What to watch for confirmation: The signal strengthens if exchange balances continue declining through the $49 million SOL level — extending the trend beyond its current range. The signal is weakened if exchange balances reverse and climb back toward 52 million SOL, indicating re-deposits and potential distribution intent. Understanding how on-chain supply signals interact with market sentiment is covered in depth in this analysis of narrative cycles and investor behavior.
The Demand + Supply Convergence — Martinez’s Core Thesis
Martinez frames the exchange supply decline explicitly as aligned with growing demand — the two-sided equation that drives price. Supply contraction in isolation is a muted signal. Demand growth in isolation is a muted signal. The convergence of both simultaneously is where structural price moves originate.
The mechanism chain, as Martinez presents it:
Demand rises — new buyers entering, existing holders adding
Exchange supply falls — existing holders withdrawing, reducing sell availability
Market depth thins — fewer tokens available at current levels to absorb buy orders
Price sensitivity increases — the same buy volume moves price more than it did when supply was higher
This is not a prediction. It is a description of market mechanics. When available supply contracts and demand holds or grows, the clearing price must rise to incentivize holders to sell. That is the supply squeeze setup Martinez is identifying.
Scenarios — What Confirmation and Invalidation Look Like
Bullish Scenario — Exchange Balance Continues Below 50M SOL
If exchange balances extend below 50 million SOL while demand signals flagged by Martinez remain elevated, the supply squeeze thesis gains structural validation. Under this scenario, any meaningful demand catalyst — institutional inflow, protocol milestone, or broader market strength — would encounter a significantly thinner sell wall than existed at 53 million SOL. The immediate upside target to watch is a reclaim of $105, the level preceding the recent drawdown.
Bearish Scenario — Re-Deposits Push Balance Back Toward 52M–53M SOL
If exchange balances reverse and climb back toward 52 million to 53 million SOL, it would indicate that recent withdrawals were tactical rather than long-term accumulation. Re-deposits at scale would restore sell-side supply and remove the supply squeeze thesis entirely. In this scenario, SOL’s current price at $96.58 lacks structural support from supply dynamics, and the path to $88–$90 support becomes more probable.
Bottom Line
On-chain analyst Ali Martinez (@alicharts) has identified a clean, measurable supply dynamic: 3 million SOL — approximately $289.7 million at current prices — withdrawn from exchanges over the past 30 days, reducing the immediately available sell pool by 5.7% from a peak of 53 million to approximately 50 million SOL as of September 14. The withdrawal occurred in two distinct phases with no reversal, consistent with accumulation behavior rather than short-term repositioning. At Solana’s current price of $96.58, the supply contraction is structurally bullish — but the thesis requires demand confirmation to activate.
The metric to track is straightforward: exchange balance data updated in real time. Watch whether SOL exchange balances hold below 50 million SOL as the critical threshold separating supply-squeeze conditions from distribution. A reversal back above 52 million would invalidate the setup. A continued decline below 49 million would strengthen it materially.
Disclaimer: The views and analysis presented in this article are for informational purposes only and reflect the author’s perspective, not financial advice. Technical patterns and indicators discussed are subject to market volatility and may or may not yield anticipated results. Investors are advised to exercise caution, conduct independent research, and make decisions aligned with their individual risk tolerance.