

Most "breakouts" on BTC are just liquidity sweeps that trap chasers. The thing I actually watch is structure: is price making higher highs and higher lows, or did it just print the first lower high?
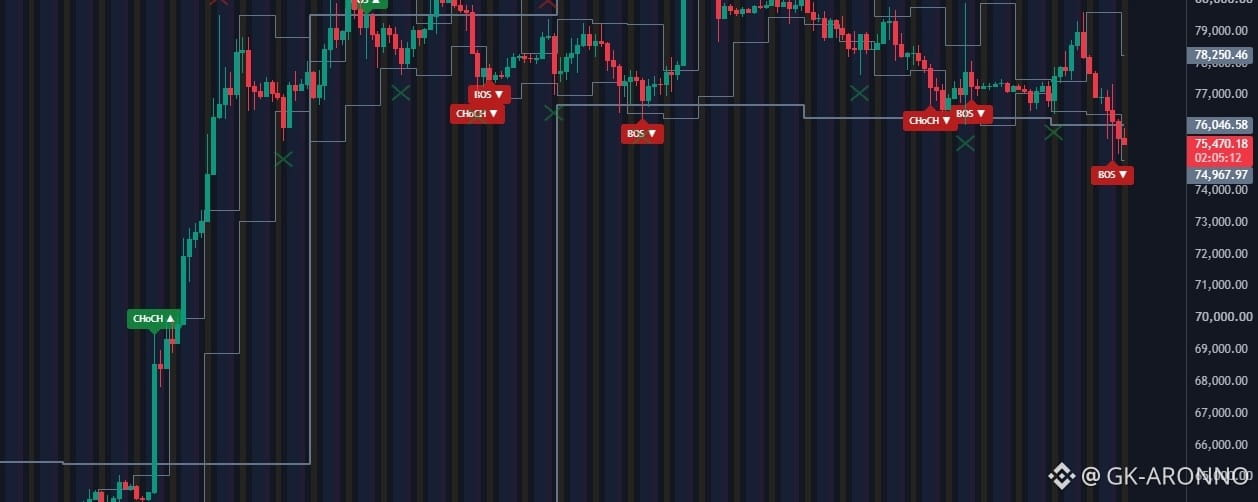
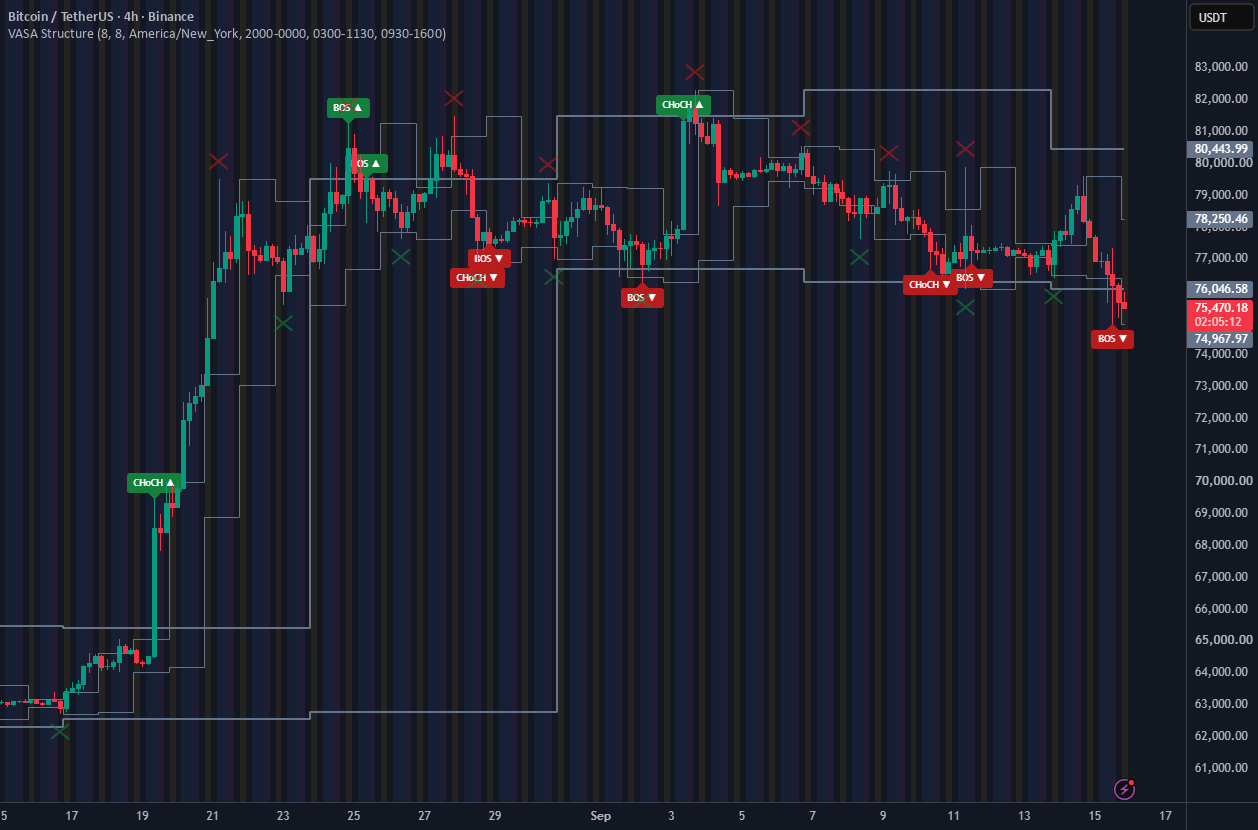
On this 4H chart I've got the VASA Market Structure tool marking the confirmed swing points, a Break of Structure (BOS = trend continuing) and a Change of Character (CHoCH = first sign the trend may be turning). The point isn't to predict the next candle — it's to know which regime you're in so you're not longing into a lower-high or shorting into a higher-low.
How I use it: wait for the level to actually be confirmed (the marker only prints once the swing completes — it doesn't repaint), then let price come to me at the level instead of chasing. You choose your own entry, stop and target; the tool just keeps the structure honest.
The VASA Market Structure indicator is free on my profile if you want to run it on your own charts.
Educational only — not financial advice. I'm sharing how I read the chart, not a call. Trading involves substantial risk of loss.
