📊 BTC/USDT 15m Chart Analysis: What’s Next for Bitcoin?
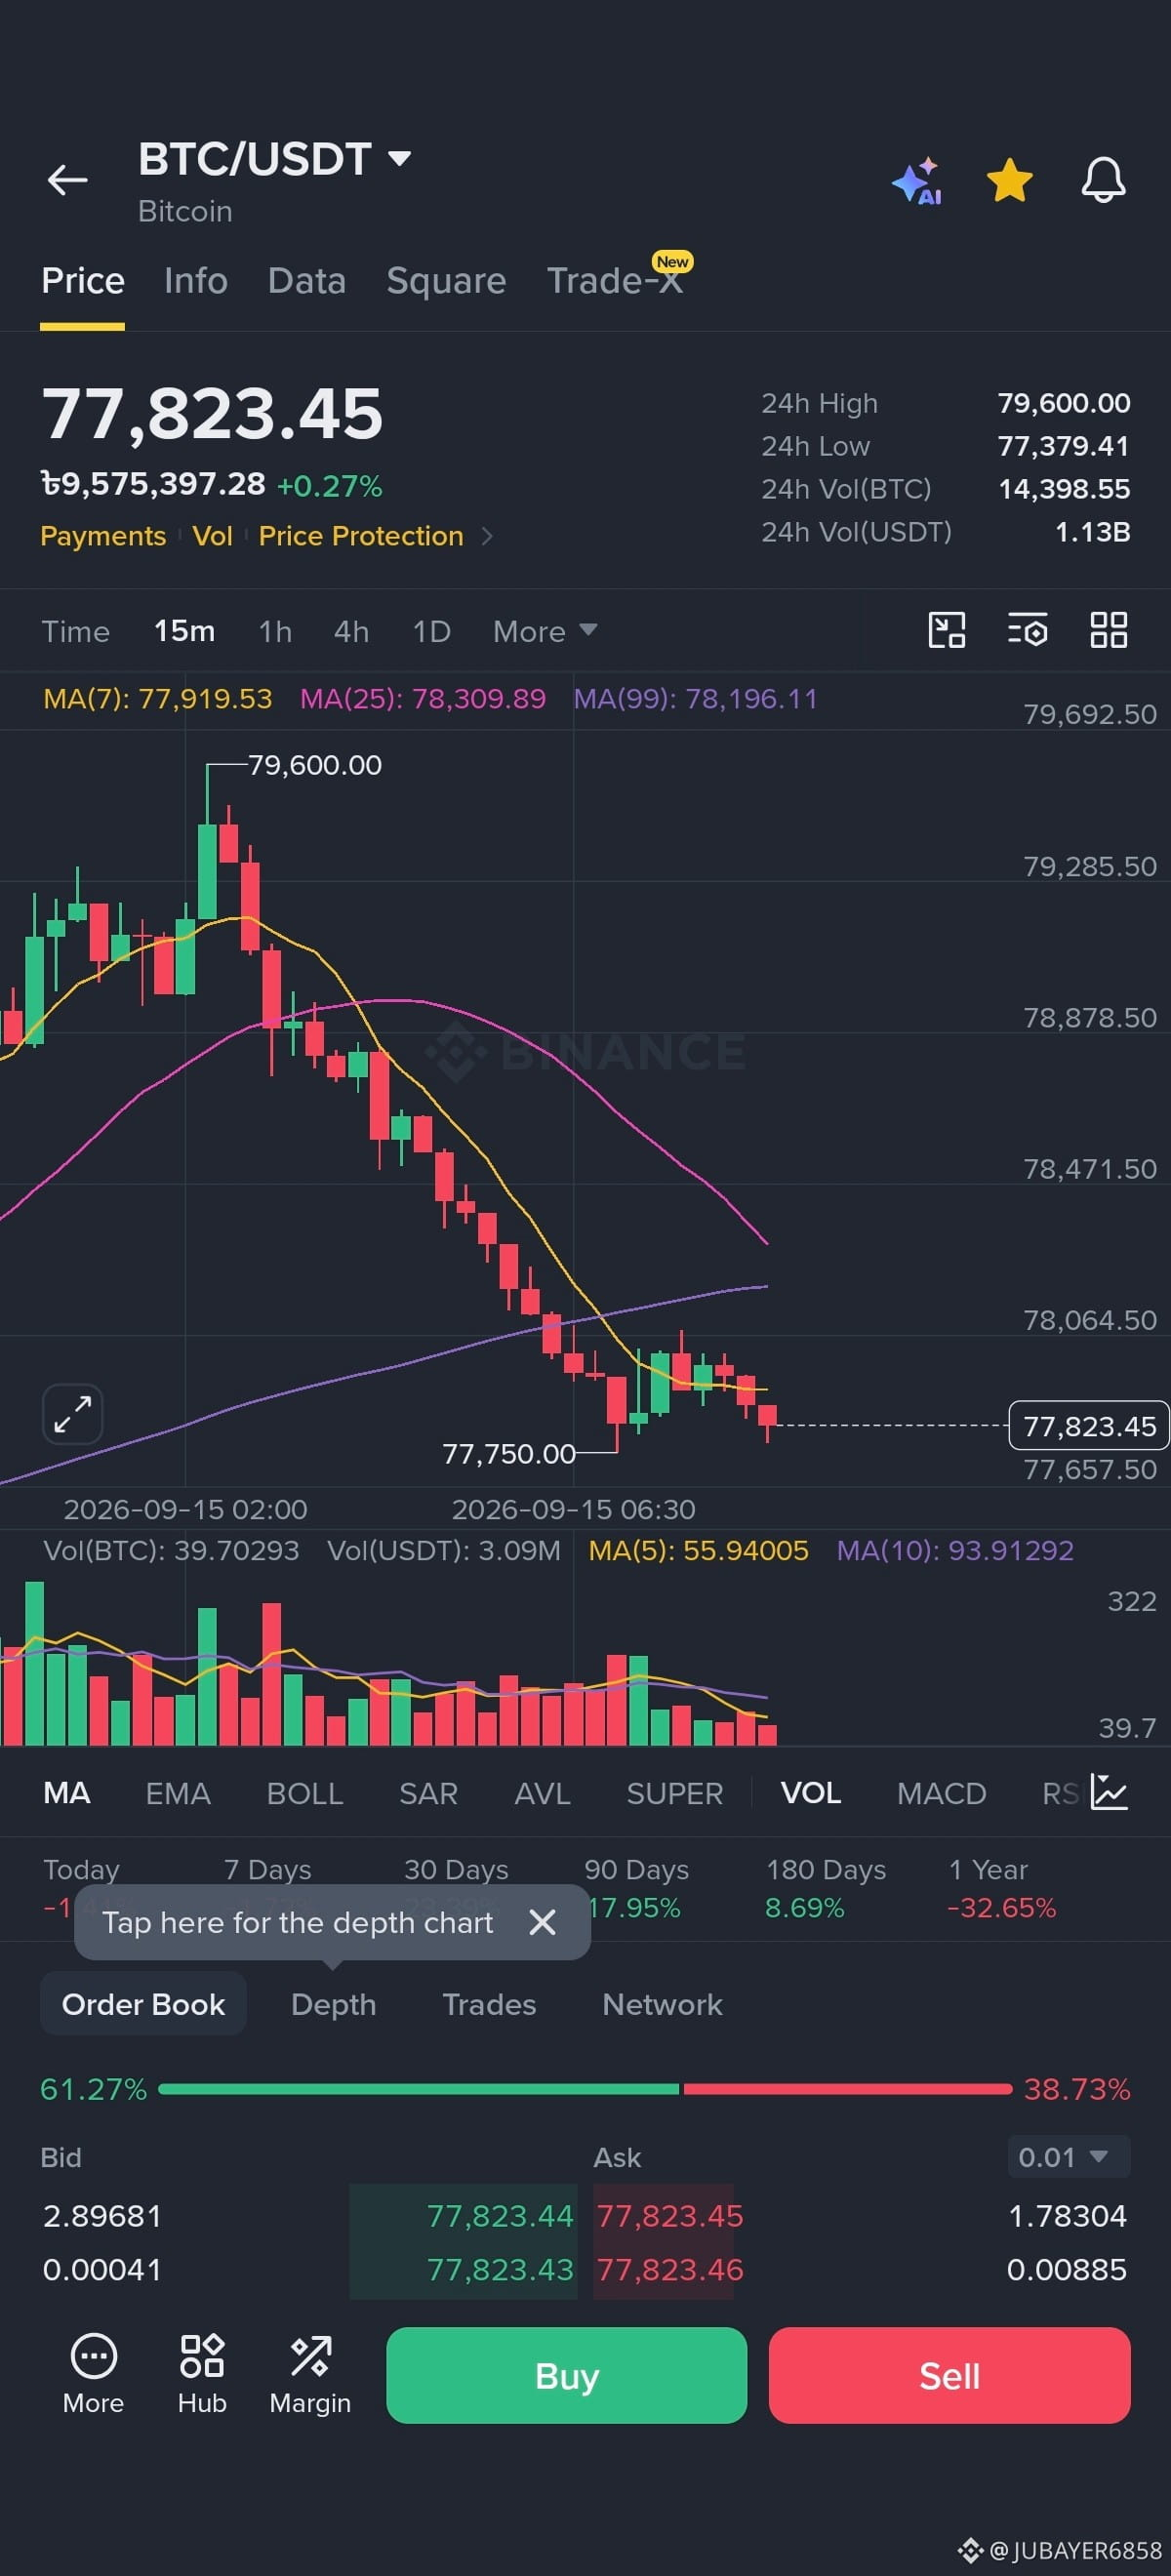
Bitcoin ($BTC ) is currently trading around $77,823, showing short-term consolidation following a steep rejection from the 24-hour high at $79,600. On the 15-minute timeframe, BTC is struggling under bearish pressure as price trades below key short-term moving averages.
🔑 Key Technical Levels
Immediate Resistance Zone: $78,100 – $78,300 (MA 7, MA 25, & MA 99 cluster)
Major Resistance: $79,600 (24h High)
Immediate Support: $77,750 (Recent local swing low)
Major Support: $77,380 (24h Low)
📈 Technical Scenarios
Bearish Breakdown Scenario:
Price remains capped under all three key Moving Averages (MA7 @ $77,919, MA25 @ $78,309, MA99 @ $78,196).
A clean breakdown below $77,750 with sustained volume will likely push BTC toward the 24h low around $77,380, with a risk of extending down to $76,800.
Bullish Relief Bounce Scenario:
If buyers successfully defend the $77,750 support, a minor relief bounce toward $78,200 is possible.
To regain bullish control, BTC needs a solid 15-minute candle close above $78,300, opening the path back toward $79,000+.
💡 Trading Strategy
Bearish Bias: Favor shorting on weak rejections near $78,200 or on a confirmed breakdown below $77,750.
Bullish Bias: Wait for a confirmed breakout and close above $78,300 before opening long positions.
Always use proper risk management and set stop-loss orders.
#BTC #CryptoAnalysis #BinanceSquare #TechnicalAnalysis #Bitcoin #CryptoTrading
Bitcoin ($BTC ) is currently trading around $77,823, showing short-term consolidation following a steep rejection from the 24-hour high at $79,600. On the 15-minute timeframe, BTC is struggling under bearish pressure as price trades below key short-term moving averages.
🔑 Key Technical Levels
Immediate Resistance Zone: $78,100 – $78,300 (MA 7, MA 25, & MA 99 cluster)
Major Resistance: $79,600 (24h High)
Immediate Support: $77,750 (Recent local swing low)
Major Support: $77,380 (24h Low)
📈 Technical Scenarios
Bearish Breakdown Scenario:
Price remains capped under all three key Moving Averages (MA7 @ $77,919, MA25 @ $78,309, MA99 @ $78,196).
A clean breakdown below $77,750 with sustained volume will likely push BTC toward the 24h low around $77,380, with a risk of extending down to $76,800.
Bullish Relief Bounce Scenario:
If buyers successfully defend the $77,750 support, a minor relief bounce toward $78,200 is possible.
To regain bullish control, BTC needs a solid 15-minute candle close above $78,300, opening the path back toward $79,000+.
💡 Trading Strategy
Bearish Bias: Favor shorting on weak rejections near $78,200 or on a confirmed breakdown below $77,750.
Bullish Bias: Wait for a confirmed breakout and close above $78,300 before opening long positions.
Always use proper risk management and set stop-loss orders.
#BTC #CryptoAnalysis #BinanceSquare #TechnicalAnalysis #Bitcoin #CryptoTrading