"Everything is going exactly as I told you.
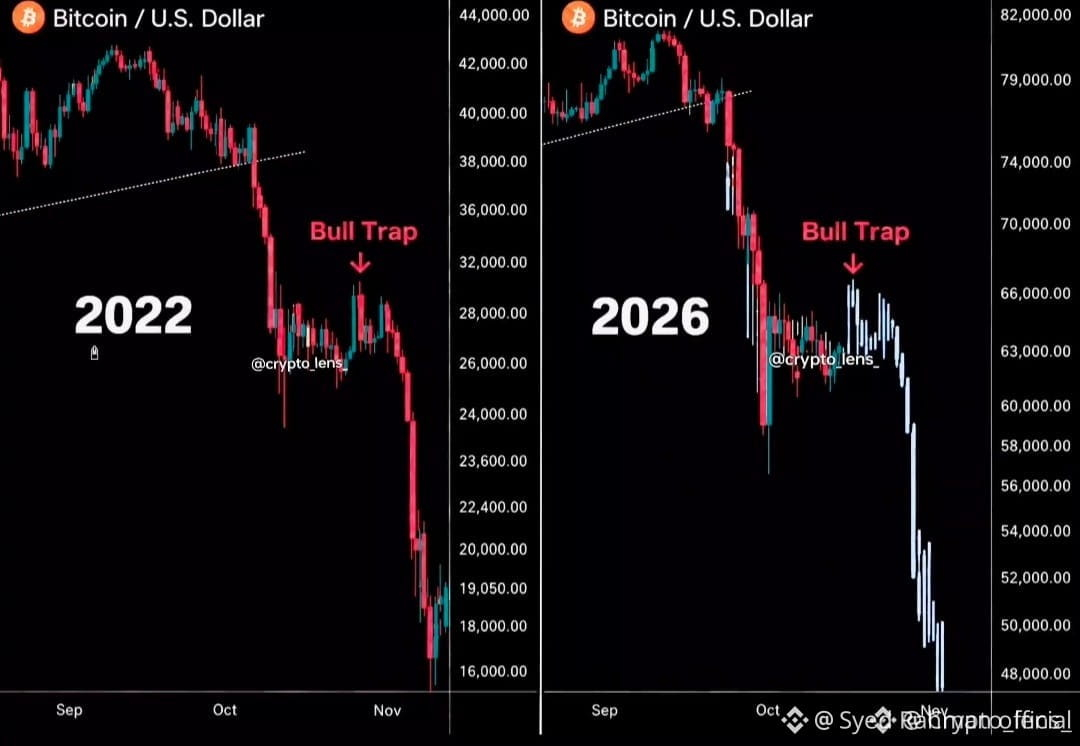
This chart has perfectly predicted the current Bull Trap to $79,890
We’re mirroring the 2022 pattern right now, and $BTC will dump to $53,000 next week.
$77K → $67K → $57K → $50K
Don’t become exit liquidity.
Bookmark this chart - you'll come back to it next week
Reminder:
I called $BTC’s $126K ATH - and the massive $97K → $60K & $83K → $57K dumps.
My next call will be the biggest one of this cycle.
Turn on notifications. Most people will follow me too late." means that the author believes Bitcoin is repeating a bearish price pattern similar to 2022. They describe the recent move toward $79,890 as a bull trap—a temporary rise that could lure buyers in before a sharp decline.
The projected sequence, $77K → $67K → $57K → $50K, is their personal scenario for a fast drop, with a claim that $BTC could reach about $53,000 next week. “Don’t become exit liquidity” is a warning not to buy at elevated prices only for earlier holders to sell into that demand.
The post also promotes the author’s past market calls and asks readers to turn on notifications, implying that their future predictions may be valuable. However, chart similarities and prior correct calls do not prove that Bitcoin will follow the same path again; market conditions, liquidity, macroeconomic events, and sentiment can differ substantially. Treat the stated targets as one trader’s opinion rather than a confirmed forecast.
This is market commentary, not investment advice.
This chart has perfectly predicted the current Bull Trap to $79,890
We’re mirroring the 2022 pattern right now, and $BTC will dump to $53,000 next week.
$77K → $67K → $57K → $50K
Don’t become exit liquidity.
Bookmark this chart - you'll come back to it next week
Reminder:
I called $BTC’s $126K ATH - and the massive $97K → $60K & $83K → $57K dumps.
My next call will be the biggest one of this cycle.
Turn on notifications. Most people will follow me too late." means that the author believes Bitcoin is repeating a bearish price pattern similar to 2022. They describe the recent move toward $79,890 as a bull trap—a temporary rise that could lure buyers in before a sharp decline.
The projected sequence, $77K → $67K → $57K → $50K, is their personal scenario for a fast drop, with a claim that $BTC could reach about $53,000 next week. “Don’t become exit liquidity” is a warning not to buy at elevated prices only for earlier holders to sell into that demand.
The post also promotes the author’s past market calls and asks readers to turn on notifications, implying that their future predictions may be valuable. However, chart similarities and prior correct calls do not prove that Bitcoin will follow the same path again; market conditions, liquidity, macroeconomic events, and sentiment can differ substantially. Treat the stated targets as one trader’s opinion rather than a confirmed forecast.
This is market commentary, not investment advice.