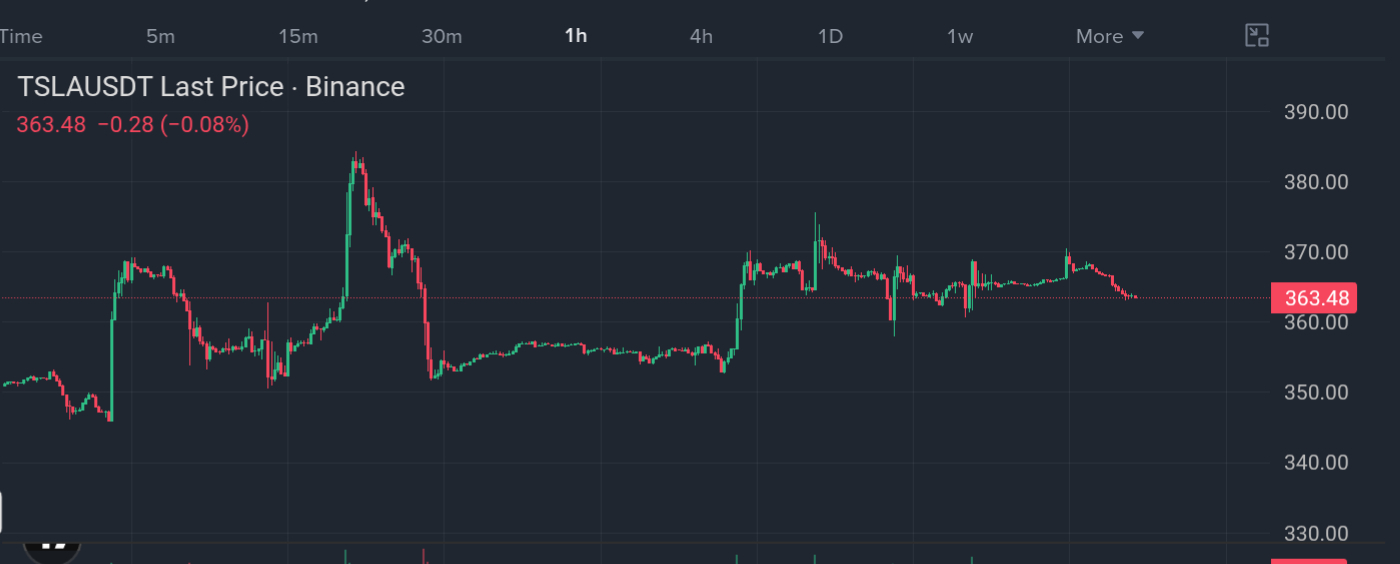

Tesla is currently trading at 363.49, down 0.65% on the day and off 1.10% intraday, with price sitting near the lower half of its recent trading band. The 24h range has been fairly tight, between a low of 363.08 and a high of 370.39, suggesting some short-term stabilization after a sharper move lower earlier in the session.
Zooming out on the daily chart, TSLA spent March through July trading in a broad 380–460 range, with several failed attempts to break higher. A sharp breakdown followed, sending price down to the 320 region before a partial recovery brought it back toward the 360–440 zone. Since then, the stock has been consolidating below its prior highs, unable to reclaim the 440+ levels seen mid-year.
The order book currently leans bearish, with sell-side pressure at 57.39% versus 42.61% on the buy side, indicating short-term sentiment remains cautious. Performance data reflects this mixed picture: TSLA is up a modest 1.86% over 7 days and 6.93% over 30 days, but down 10.34% over 90 days and 8.47% over the past 180 days — signaling the broader trend is still working through a correction.
Key levels worth watching: a hold above 360 keeps the recovery structure intact, while a break below 320 would risk reopening deeper downside toward earlier support zones. For now, TSLA looks caught between recovery attempts and lingering weakness from its mid-year highs.