

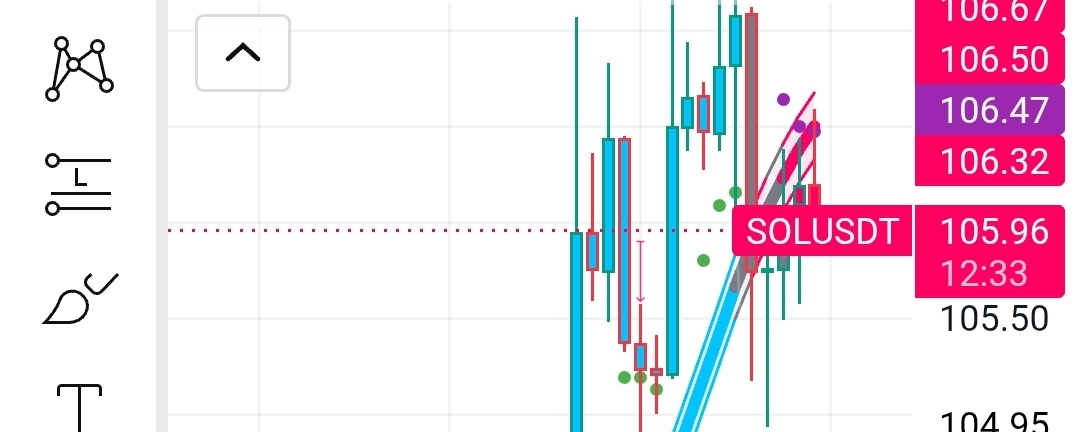

Solana (SOL) is showing renewed bullish momentum on the 1-hour chart, with the price trading near $105.96, up 2.68% at the time of the screenshot. The recent recovery has pushed SOL back toward a key resistance zone, where the next move could determine whether the rally continues.

### Solana
SOL/USDT · 1-hour chart
+2.68%
Current price
### $105.96
Immediate resistance
### $106.32–$106.67
### SOL technical outlook
The chart shows a strong upward move from the $101.50–$102.00 area, followed by a recovery toward $106.00. Price is now consolidating near the upper part of the recent range.
The rising moving-average structure supports the short-term bullish trend, but the latest candles also show hesitation near resistance. This makes the $106.50 area an important level to watch.
### Key levels to watch
| Level | Importance |
| ------- | -------------------------- |
| $106.67 | Upper resistance |
| $106.50 | Major breakout area |
| $106.32 | Immediate resistance |
| $105.50 | First support |
| $104.95 | Important pullback support |
| $104.50 | Deeper support |
### Bullish scenario
If SOL breaks above $106.50 and holds that level on the 1-hour chart, buyers could attempt to push the price toward $106.67. A sustained move above the resistance zone would strengthen the bullish setup and could open the way for a further recovery.
A breakout should ideally be supported by strong buying volume. Without confirmation, a move above resistance could turn into a false breakout.
### Bearish scenario
If SOL fails to break the resistance zone and sellers take control, the first support to watch is $105.50. A break below that level could bring $104.95 into focus.
A deeper pullback toward $104.50 would suggest that the recent bullish momentum is weakening. However, the broader short-term structure would remain more constructive as long as buyers continue defending the higher support levels.
### Final verdict
SOL remains cautiously bullish above $105.50, but $106.50 is the key breakout level. A confirmed move above resistance could support another upward move, while rejection may lead to a short-term pullback.
For traders, the important thing is to watch the 1-hour candle close and volume, rather than chasing a move in the middle of the resistance zone.
This is a technical analysis based on the supplied chart, not financial advice. Cryptocurrency prices
are highly volatile, and key levels can change quickly.
