

Bitcoin is sitting at a critical crossroads, and the biggest signal may be coming from wallets rather than the chart.
While $BTC has pulled back from its recent $81,500 area and is now trading around the upper $70,000s, large holders have reportedly added more than 39,154 BTC over the past seven days. That represents roughly $3 billion worth of Bitcoin at recent prices.
At the same time, U.S. spot Bitcoin ETFs have continued attracting capital, with recent data showing August inflows have already crossed $3 billion.
So why is Bitcoin not breaking higher immediately?
Because the market is facing a battle between strong accumulation underneath and heavy resistance above.

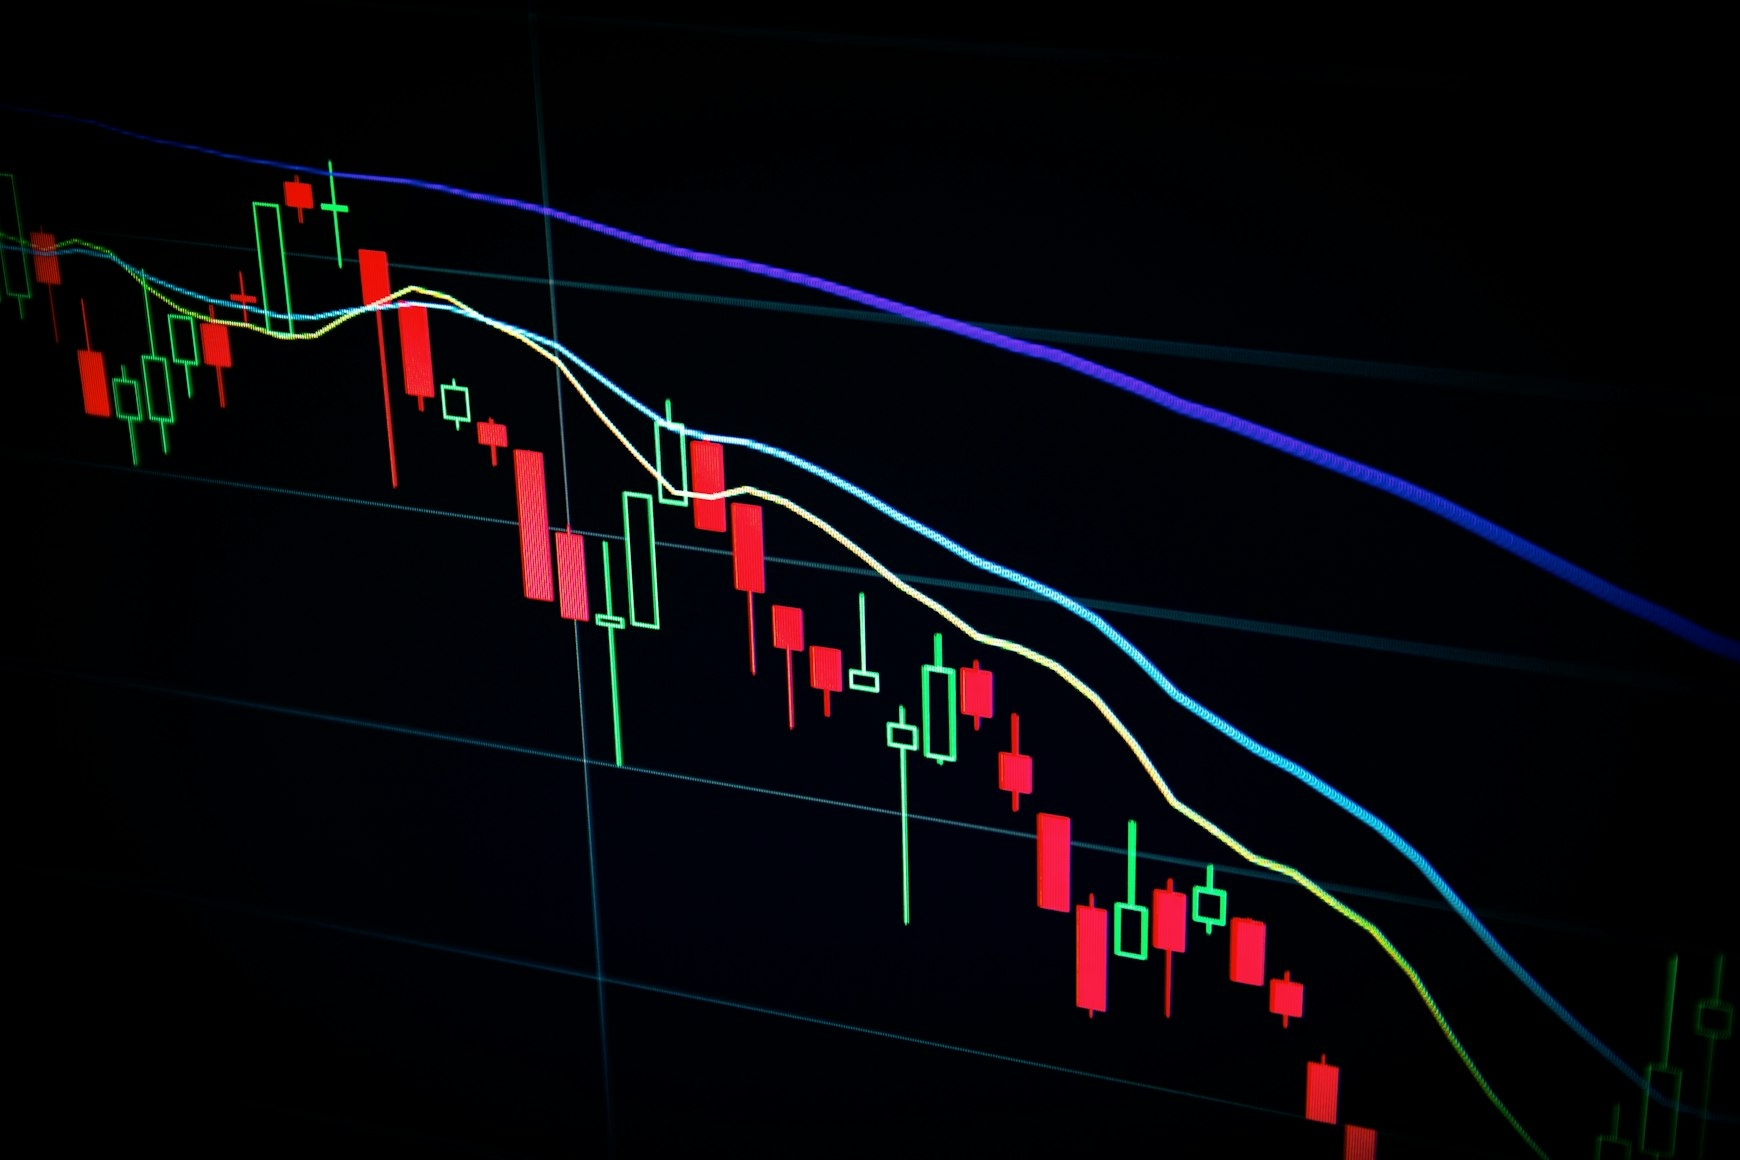
This is the key visual location for the article. Use a clean 4H BTC chart showing the recent rally, rejection from the $81K to $82K area, current price, support near $78K and resistance near $81K.
🐋 The $3 Billion Whale Signal
The latest on chain data creates an interesting divergence.
Wallets holding at least 100 BTC reportedly added approximately 39,154 BTC during the past seven days. The larger cohort holding more than 10,000 BTC has also accumulated heavily, with 46,420 BTC added over the previous 60 days.
Meanwhile, smaller Bitcoin holders have been taking profits during the recovery.
This difference matters.
When smaller participants sell into strength while larger holders absorb supply, it can indicate that sophisticated investors are positioning for a longer term move rather than chasing short term momentum.
But there is an important distinction.
Whale accumulation is not a guaranteed bullish signal.
Large holders can accumulate while price continues to correct. They can also change their positioning quickly if market conditions deteriorate.
Therefore, the whale data should be treated as confirmation of demand, not as a prediction of the next candle.
💰 ETF Demand Is Adding Fuel
The whale activity is not happening in isolation.
U.S. spot Bitcoin ETFs have also attracted substantial capital during August. Recent reports put monthly ETF inflows above $3 billion, with a notable streak of consecutive positive sessions during the recent rally.

Another recent report showed that spot Bitcoin ETFs attracted more than $900 million during the latest week, although the final session was negative after a more hawkish tone from Federal Reserve Chair nominee Kevin Warsh.
This creates an interesting market structure.
On one side:
🐋 Large holders are accumulating.
💰 ETF investors are providing demand.
📈 Bitcoin has recovered sharply from its recent lows.
On the other side:
📉 BTC is still facing major resistance.
⚠️ Profit taking remains active.
🌎 Macro conditions can quickly change risk appetite.
That is why the next breakout needs confirmation.
🔥 Why the $81K Area Matters
Bitcoin recently pushed above $81,000 before losing momentum.
The move was strong, but the market could not establish a sustained breakout above that region. Current reporting shows BTC around $78,000 after reaching approximately $81,455 during the recent rally.
This makes the $81K area the first major test for buyers.

If $BTC returns to this zone and breaks above it with expanding volume, the market could interpret the move as a continuation of the recovery.
But if price reaches resistance again and gets rejected, traders could see another round of profit taking.
The most important confirmation would be a clean 4H close above resistance followed by a successful retest.
That would transform resistance into support.
📍 Key Levels To Watch
Support Zone: $77,500–$78,500
Major Support: $75,500–$76,500
Resistance: $81,000
Major Resistance: $82,000–$83,000
Bullish Confirmation:
A strong 4H close above $81,000 with increasing buy volume would strengthen the breakout case.
A successful retest of $81,000 as support would provide additional confirmation.
Bearish Warning:
Repeated rejection from $81,000 followed by a loss of the $77,500–$78,500 area would suggest that sellers are gaining control.
Deeper Weakness:
A sustained move below $76,000 would significantly weaken the current recovery structure.
🎯 Potential Trading Framework
For traders watching BTC, the important thing is not to chase the first move.
A potential bullish setup would develop if Bitcoin holds the $77,500–$78,500 support zone and then reclaims $81,000 with strong volume.
A cleaner entry would come from confirmation rather than guessing the breakout before it happens.
Potential Buy Zone:
$77,500–$78,500 if buyers clearly defend support.
Breakout Confirmation:
Above $81,000 after a confirmed 4H close.
Upside Areas:
$82,000–$83,000 initially, followed by higher resistance zones if momentum expands.
Invalidation:
A sustained 4H close below the major support structure would weaken the bullish thesis.
These levels are areas to monitor, not guaranteed entry points.
⚠️ The Hidden Risk Behind The Bullish Story
The biggest mistake would be assuming that whale accumulation means Bitcoin can only go higher.
It cannot.
Bitcoin has already rallied more than 25% over a recent two week period, according to recent market coverage, which means some investors have significant unrealized profits.
That creates natural selling pressure.
There is also evidence that some Bitcoin treasury companies are under pressure. The Financial Times recently reported that the combined market capitalization of major Bitcoin treasury companies has fallen sharply from its 2025 peak, while some companies have reduced their Bitcoin exposure.
This does not invalidate the whale accumulation thesis, but it shows why market structure matters.
Bitcoin can have strong demand and still experience sharp corrections.
📈 Bullish Scenario
BTC holds above the $77,500–$78,500 region.
Buyers return with increasing volume.
Price reclaims $81,000.
The breakout holds on a retest.
If that sequence develops, the $82,000–$83,000 region becomes the next major area to watch.
A decisive move beyond that zone would strengthen the broader recovery structure.
📉 Bearish Scenario
BTC fails again near $81,000.
Volume increases on rejection.
Price loses $77,500.
The market begins searching for liquidity below the current range.

In that scenario, $75,500–$76,500 becomes an important defensive area.
A deeper breakdown would indicate that the recent rally is losing structural strength.
🔎 The Real Signal Is The Divergence
The most interesting part of this market is not simply that whales are buying.
It is the divergence between large and small holders.
Large holders are accumulating.
Retail participants are taking profits.
ETF demand has returned.
Yet price remains below major resistance.
That means the market has not reached a final decision.
The whales may be positioning for another expansion phase, but buyers still need to prove they can absorb the supply waiting around $81K to $83K.
This is why the next move could be especially important.
A breakout would validate the accumulation narrative.
A rejection would show that supply is still stronger than demand at current levels.
For now, the cleanest approach is to watch the reaction rather than predict it.
🐋 The big money appears to be accumulating.
📈 The chart is still waiting for confirmation.
The battle between those two signals could determine Bitcoin's next major move.
Do you think BTC breaks above $81,000 next, or will whales get another opportunity to accumulate lower?
Educational only. Not financial advice. Manage risk.
#BTC #bitcoin #CryptoNews #CryptoAnalysis #BitcoinETF