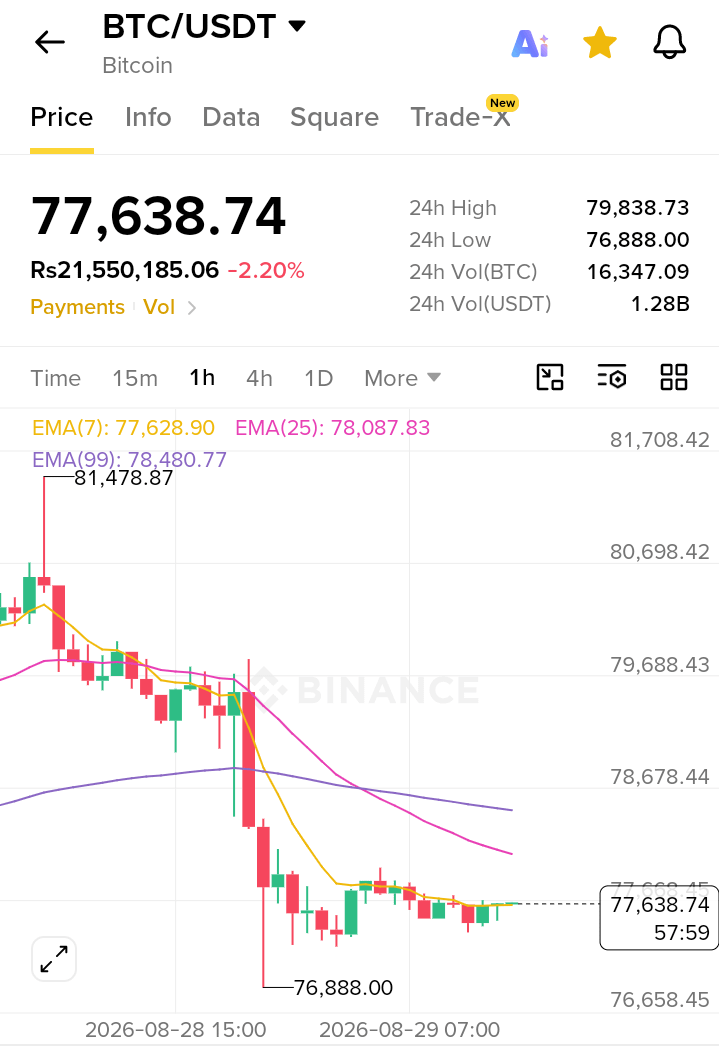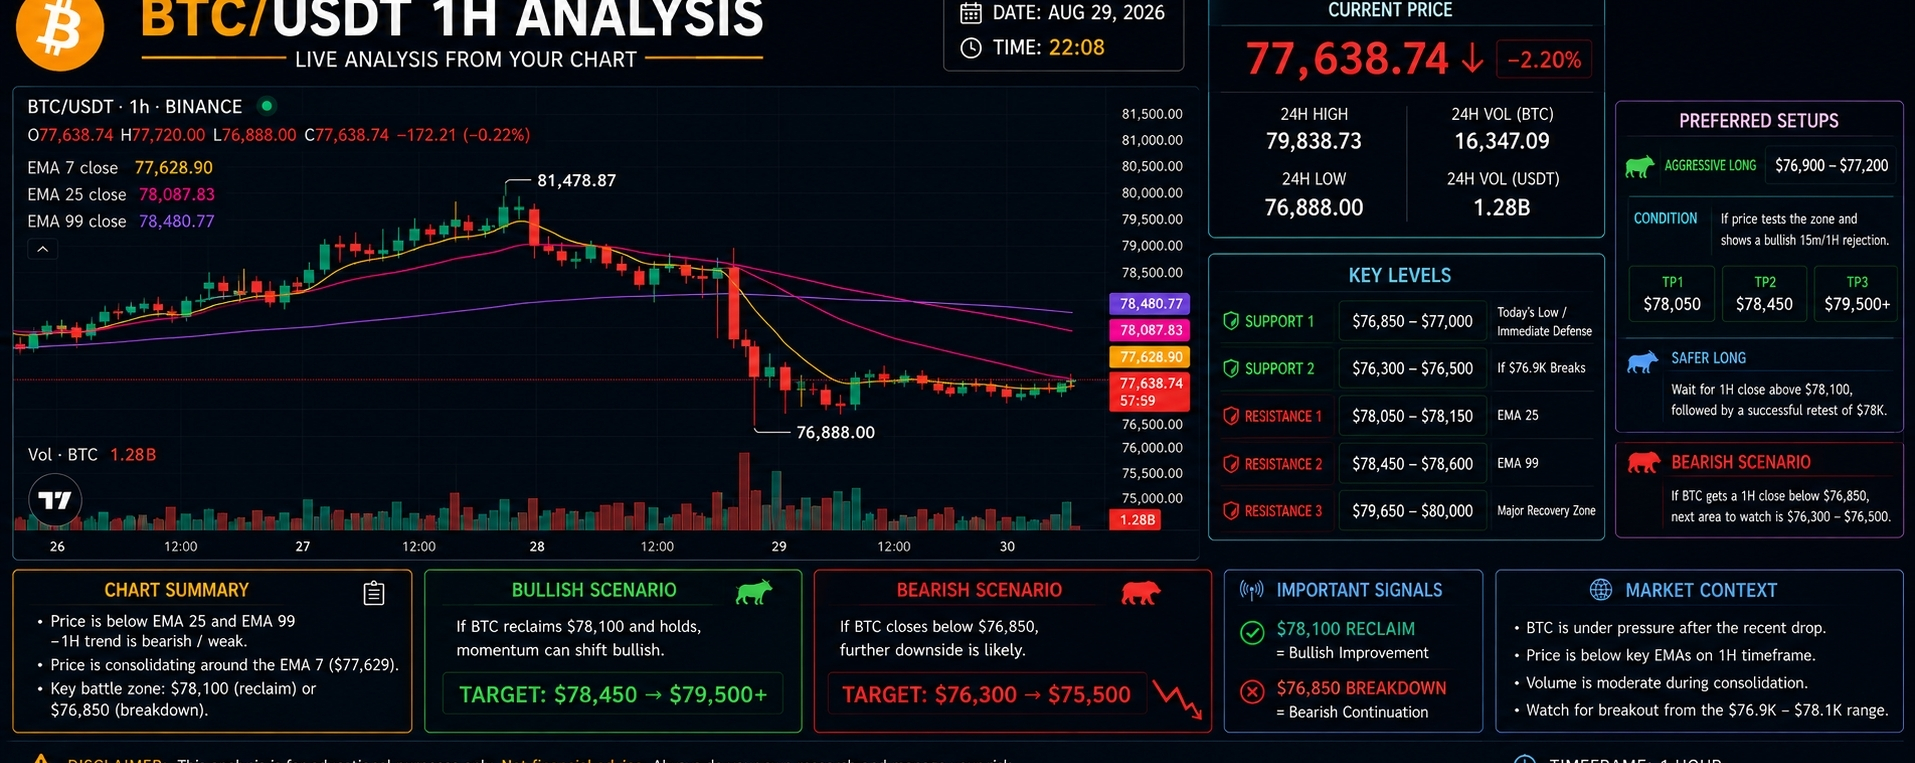

Chart shows BTC at $77,638, down about 2.2%, with a 24h low of $76,888.
Current: $77,638
EMA 7: $77,629 → price is sitting right on it
EMA 25: $78,088 → immediate resistance
EMA 99: $78,481 → stronger resistance
The important thing is that BTC is below both the 25 EMA and 99 EMA, so the 1H trend is still bearish/weak. The small candles around $77.6K show consolidation after the sharp drop.
Key levels I'd watch
Zone Level Meaning
🟢 Support 1 $76,850–77,000 Today's low / immediate defense
🟢 Support 2 $76,300–76,500 If $76.9K breaks##
🔴 Resistance 1 $78,050–78,150 EMA 25
🔴 Resistance 2 $78,450–78,600 EMA 99
🔴 Resistance 3 $79,650–80,000 Major recovery zone
Current market data also has BTC around $77.5K–$77.7K, confirming that your screenshot is broadly current.
🎯 My preferred setup
I would NOT chase a long at $77,638 yet.
Aggressive long:
➡️ $76,900–77,200 if price tests the zone and shows a bullish 15m/1H rejection.
🎯 TP1: $78,050
🎯 TP2: $78,450
🎯 TP3: $79,500+
Safer long:
Wait for a 1H close above $78,100, followed by a successful retest of $78K. That would reclaim the 25 EMA and give a better confirmation.
Bearish scenario:
If BTC gets a 1H close below $76,850, I would avoid catching the falling knife. Next area I'd watch is approximately $76,300–76,500.
The broader market is also currently under pressure after the recent drop; BTC has been trading around the $77K area after falling below $78K.