

Bitcoin price has fallen roughly 2.5% and is now trading around $77,600, joining a broader correction across the crypto market. The pullback comes after BTC recently climbed as high as $81,500, extending a rally that began around $62,229 at the start of August.
The immediate pressure on crypto has largely come from the Federal Reserve’s Jackson Hole conference, where Fed Chair Kevin Warsh delivered a more hawkish message on inflation and interest rates. But underneath the market-wide selloff, an interesting divergence is developing between different groups of Bitcoin holders.
Crypto analyst Ali Martinez shared data showing that smaller BTC wallets have been selling throughout much of the recent rally, while some of Bitcoin’s largest holders have been doing the opposite.
His message was simple: “Retail sells. Whales buy.”
Bitcoin Whales Are Buying While Smaller Holders Sell
According to Martinez, Bitcoin gained roughly 31% from its August 1 level of $62,229 to $81,500, but wallets holding between 0.1 and 1 BTC did not appear convinced by the rally.
He pointed to an Accumulation Trend Score of -0.982 for this cohort, describing it as evidence that smaller holders have been distributing BTC rather than accumulating it.
At the same time, wallets containing 100 BTC or more have generally moved in the opposite direction.
The accumulation heatmap shared by Martinez makes the contrast particularly visible.
The chart divides Bitcoin addresses into cohorts ranging from wallets holding less than 0.1 BTC all the way to enormous addresses containing between 100,000 and 1 million BTC. Red indicates stronger distribution, while green and blue indicate progressively stronger accumulation.
The smallest cohorts sit deep in red.
BITCOIN: RETAIL SELLS. WHALES BUY. Bitcoin is up 31%, and retail has been selling the entire rally. Since August 1, BTC has jumped from $62,229 to $81,500, while wallets holding 0.1–1 BTC recorded an Accumulation Trend Score of -0.982. At the same time, whales holding 100+… pic.twitter.com/qIIiAPEXEY
— Ali Charts (@alicharts) August 28, 2026
Wallets containing 0–0.1 BTC and 0.1–1 BTC show persistent distribution across virtually the entire period displayed. The 1–10 BTC cohort is also heavily red, while the 10–100 BTC group remains predominantly orange and red.
Move further up the wallet-size spectrum and the picture changes.
The 100–1,000 BTC cohort is much closer to neutral, while several larger groups show periods of accumulation. Most strikingly, the 100,000–1 million BTC cohort is consistently green-to-blue and becomes increasingly blue toward the right side of the heatmap.
In other words, the chart shows a clear divergence: smaller wallets have generally been reducing exposure while some of the biggest wallets have been adding to theirs.
Are Whales Really Buying What Retail Is Selling?
That is Martinez’s interpretation, and the heatmap certainly supports the existence of a divergence between wallet cohorts.
However, there is an important distinction.
Wallet size does not perfectly identify who owns the Bitcoin inside it. A 0.1–1 BTC wallet is a reasonable proxy for smaller holders, but it cannot automatically be classified as an individual retail investor. Likewise, very large addresses can belong to exchanges, custodians, ETFs or other institutions rather than a single “whale.”
The data therefore shows small-wallet distribution versus large-wallet accumulation, rather than proving that individual whales are directly buying coins sold by retail traders.
Even with that caveat, the behavior is noteworthy because it has occurred while Bitcoin price has risen quickly.
Normally, investors selling during a 31% rally could be interpreted as profit-taking. If larger holders are simultaneously absorbing that available supply, selling pressure from smaller investors does not necessarily translate into an immediate price decline.
The question now is whether that large-holder demand continues as Bitcoin undergoes its latest correction.
Read also: Claude and ChatGPT Predict If Bitcoin’s Bear Market Is Really Over
Bitcoin ETF Flows Add Another Twist
Institutional flows are not universally bullish, either.
U.S. spot Bitcoin ETFs recorded approximately $202 million in net outflows on August 28, according to SoSoValue data cited in market reports. That ended a nine-day streak of positive flows for the products.
Interestingly, Ethereum ETFs moved in the opposite direction.
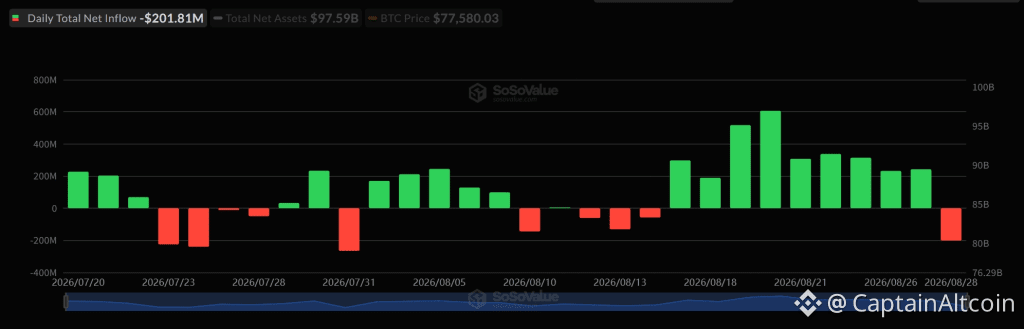 Source: SoSoValue
Spot Ethereum ETFs attracted approximately $102 million in net inflows, extending their positive streak to ten consecutive trading days.
That divergence complicates the simple narrative that all large investors are currently accumulating Bitcoin.
The wallet data indicates accumulation among certain large BTC cohorts, but the latest ETF session shows that institutional demand through regulated Bitcoin investment products has cooled, at least temporarily.
One day of ETF outflows does not establish a new trend. Still, after nine consecutive days of inflows, the reversal is worth monitoring—particularly while BTC is already under pressure.
Why Bitcoin and the Crypto Market Are Falling
The broader reason for Bitcoin’s current decline appears to be macroeconomic rather than something specific to the Bitcoin network.
Markets reacted negatively following Kevin Warsh’s comments at Jackson Hole, where the Fed Chair emphasized that inflation remains above the central bank’s target.
PCE inflation stands at 3.7% over the past year and 4.1% annualized over the previous six months, both well above the Fed’s 2% objective.
Warsh also pointed out that 54% of components in the PCE basket have increased by more than 3% over the past year. That indicates inflationary pressure remains relatively broad rather than being driven by only a handful of categories.
At the same time, the U.S. economy has remained resilient. Unemployment stands at approximately 4.1%, while jobless claims remain around multi-decade lows.
That combination is uncomfortable for risk assets.
Persistent inflation combined with a strong labor market gives the Federal Reserve less reason to ease monetary policy and potentially more room to keep financial conditions restrictive.
Markets responded quickly. The implied probability of a September rate hike jumped to 55.7%, while the U.S. dollar strengthened and risk assets came under pressure.
Bitcoin’s fall toward $77,600 should therefore be viewed within that broader macro selloff rather than as evidence that the whale-accumulation thesis has suddenly failed.
What Comes Next for Bitcoin Price?
The most interesting question is what large BTC holders do during the correction.
The heatmap indicates that smaller holders were already selling even as Bitcoin advanced from roughly $62,000 to above $81,000. Yet BTC continued higher because that supply was evidently met by sufficient demand elsewhere in the market.
If larger wallet cohorts continue accumulating as Bitcoin pulls back, it would strengthen the argument that the current decline is primarily a macro-driven correction rather than a broader deterioration in Bitcoin demand.
However, there are now two signals worth watching. The first is whether the large-wallet accumulation visible in Martinez’s data continues. The second is whether the $202 million ETF outflow becomes the beginning of a longer institutional outflow trend or proves to be an isolated interruption following nine consecutive inflow sessions.
For now, Bitcoin presents an unusual picture: price is falling, ETF flows have turned negative for a session, and smaller holders have been distributing, but some of the largest BTC wallets are still accumulating.
For more crypto news and price predictions on CaptainAltcoin, click here.
Subscribe to our YouTube channel for daily crypto updates, market insights, and expert analysis.
The post Bitcoin Price Warning: Small BTC Holders Are Selling, Whales Are Doing the Opposite appeared first on CaptainAltcoin.