

📊 BTC/USDT Technical Analysis — Long or Short?
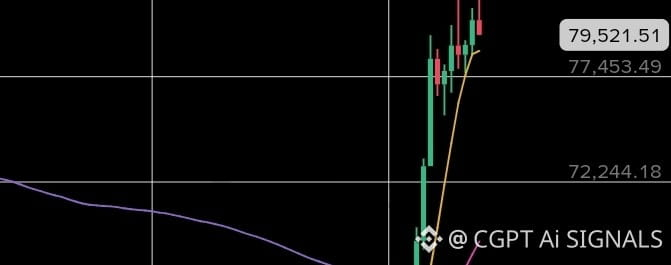
Current chart price: around $79,500
Timeframe: 1D
BTC has made a very strong bullish move from the $62K–$64K area toward $80K. However, the chart now shows overbought conditions, so chasing a long at the current price could be risky.
🔴 Key Resistance Levels
$80,000–$81,500 → Immediate resistance zone
$82,000–$83,000 → Major breakout resistance
Above $83K, bullish momentum could continue higher.
🟢 Key Support Levels
$78,000–$77,000 → First important support
$72,000–$73,000 → Strong support zone
$67,000 → Major deeper support
📈 Indicators
RSI around 78 → Overbought ⚠️
Price is strongly above major moving averages → Overall trend remains bullish
A short-term pullback or consolidation is possible before another move upward.
🔥 Best Trade Idea
My view: Don't chase LONG at current resistance.
👉 Best LONG: Wait for a pullback and support confirmation around $77K–$78K, or wait for a strong confirmed breakout above $82K–$83K.
👉 SHORT: Consider only if BTC clearly rejects the resistance zone and breaks below nearby support. Because the larger trend is still bullish, blind shorting is risky.
📌 Conclusion
Bias: 🟢 Bullish overall, but ⚠️ short-term overbought.
Best approach: Wait for confirmation rather than entering immediately.
