$NVDAUSDT LONG BULLISH MOMENTUM BUILDING
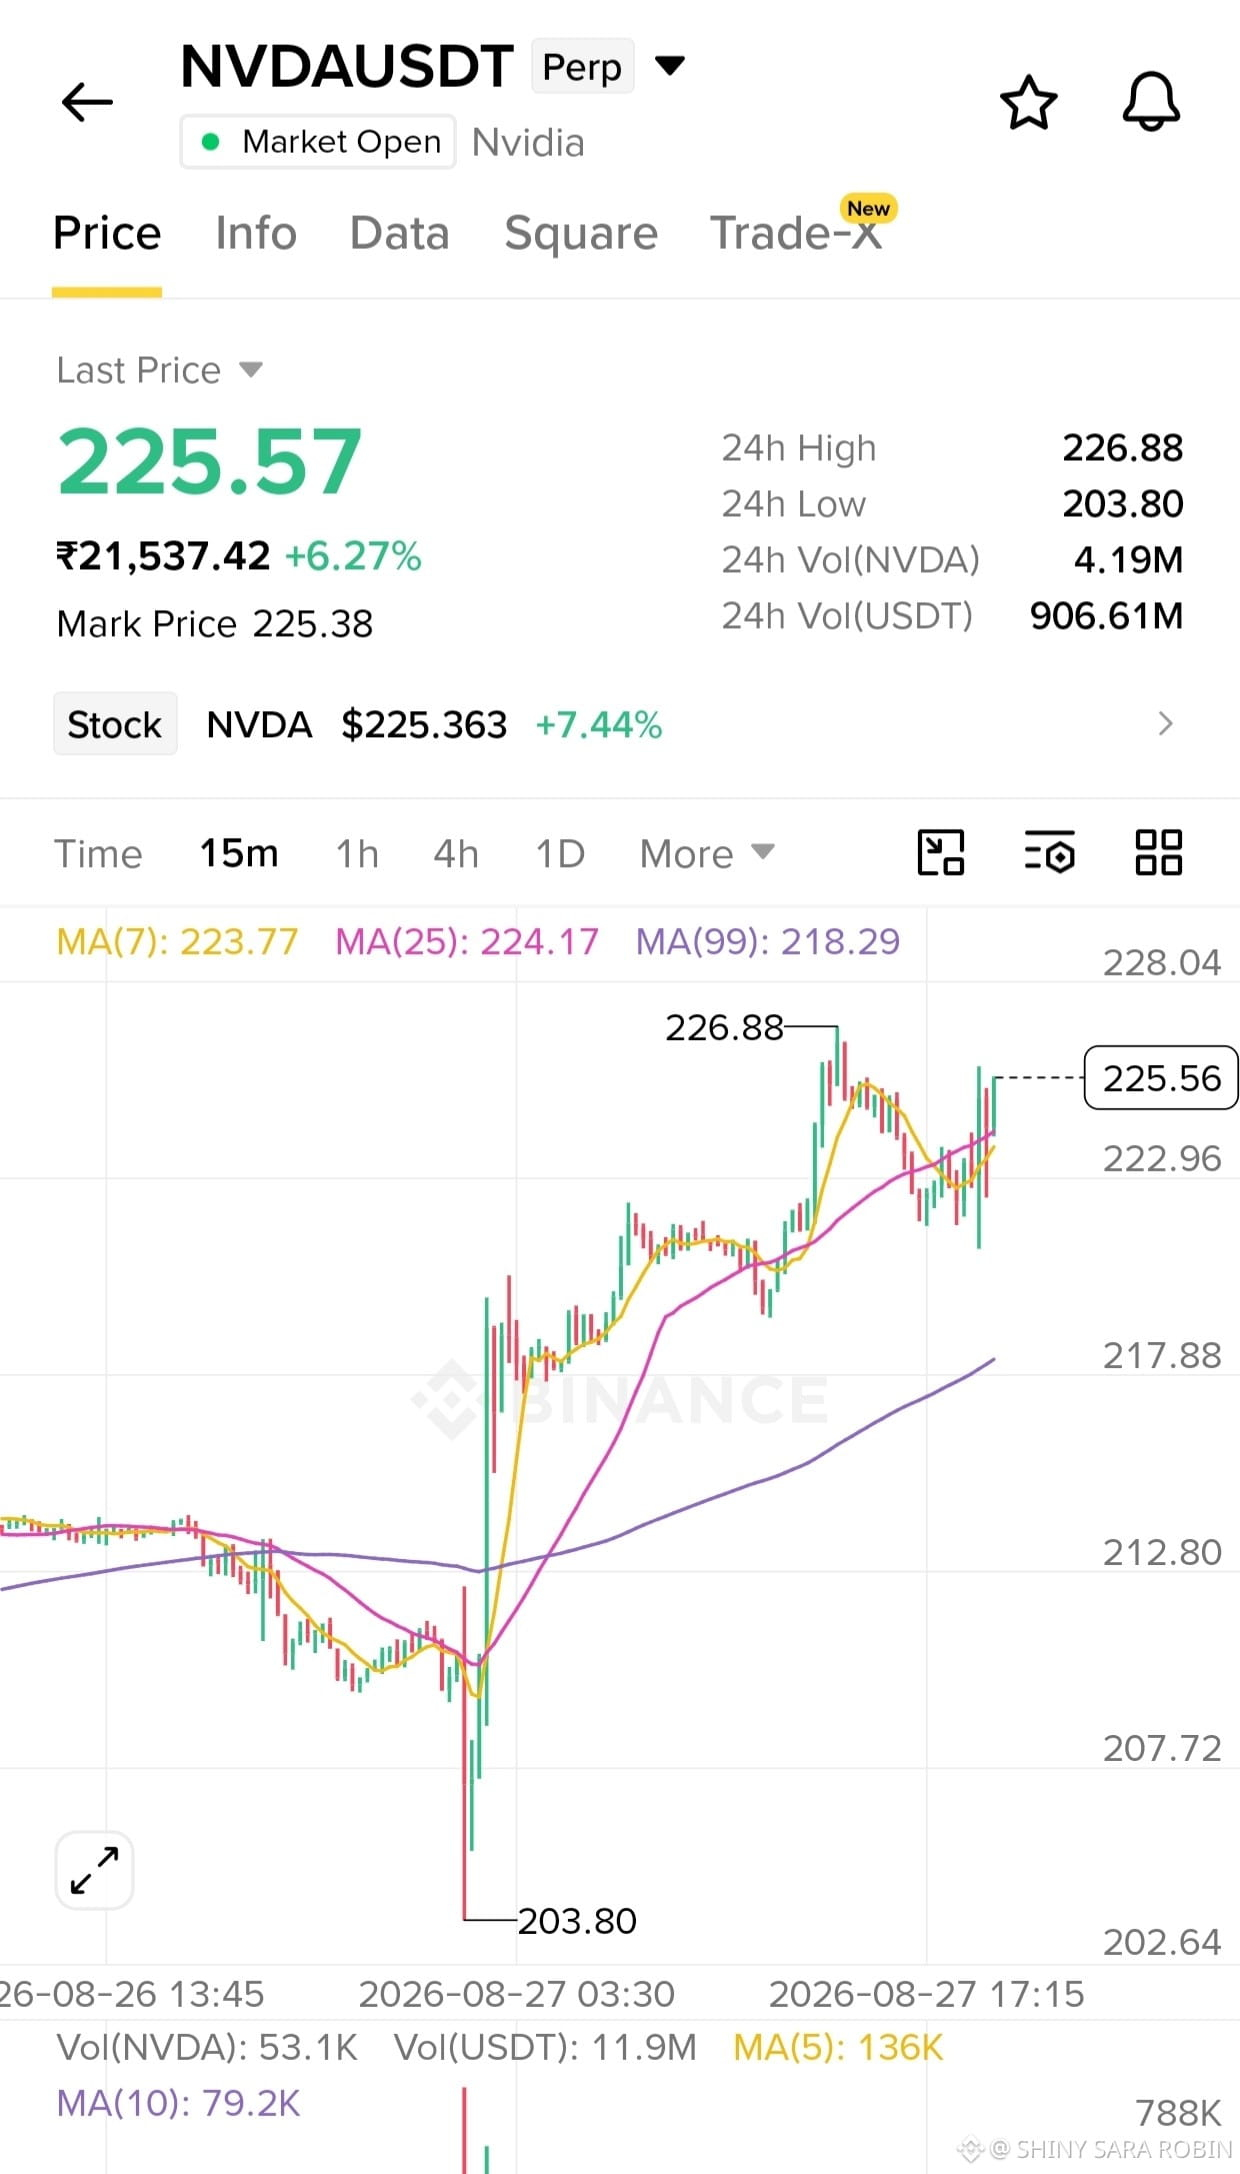
$NVDA is trading around 225.57 after a strong recovery from the 203.80 low. On the 15M chart, price is holding above MA(7), MA(25), and MA(99), showing a bullish short-term structure. The key level is the recent high at 226.88 — a clean breakout could trigger the next leg higher.
Trade Plan — LONG • Entry: 224.50 – 225.60
• TP1: 228.00
• TP2: 231.50
• TP3: 235.00
• Stop Loss: 221.80
Price is consolidating just below the 226.88 resistance while remaining above the major moving averages. A sustained break and hold above 226.88 would confirm stronger bullish continuation. If price loses 221.80, the setup is invalidated.
$NVDA
$NVDA is trading around 225.57 after a strong recovery from the 203.80 low. On the 15M chart, price is holding above MA(7), MA(25), and MA(99), showing a bullish short-term structure. The key level is the recent high at 226.88 — a clean breakout could trigger the next leg higher.
Trade Plan — LONG • Entry: 224.50 – 225.60
• TP1: 228.00
• TP2: 231.50
• TP3: 235.00
• Stop Loss: 221.80
Price is consolidating just below the 226.88 resistance while remaining above the major moving averages. A sustained break and hold above 226.88 would confirm stronger bullish continuation. If price loses 221.80, the setup is invalidated.
$NVDA