



FULL AND FINAL ANALSYS ON BITCOIN ALL YOU NEED TO KNOW ABOUT BITCOIN
FULL AND FINAL ANALSYS ON BITCOIN
BITCOIN ANALSYS UNDER WEEKLY TIMEFRAME👇
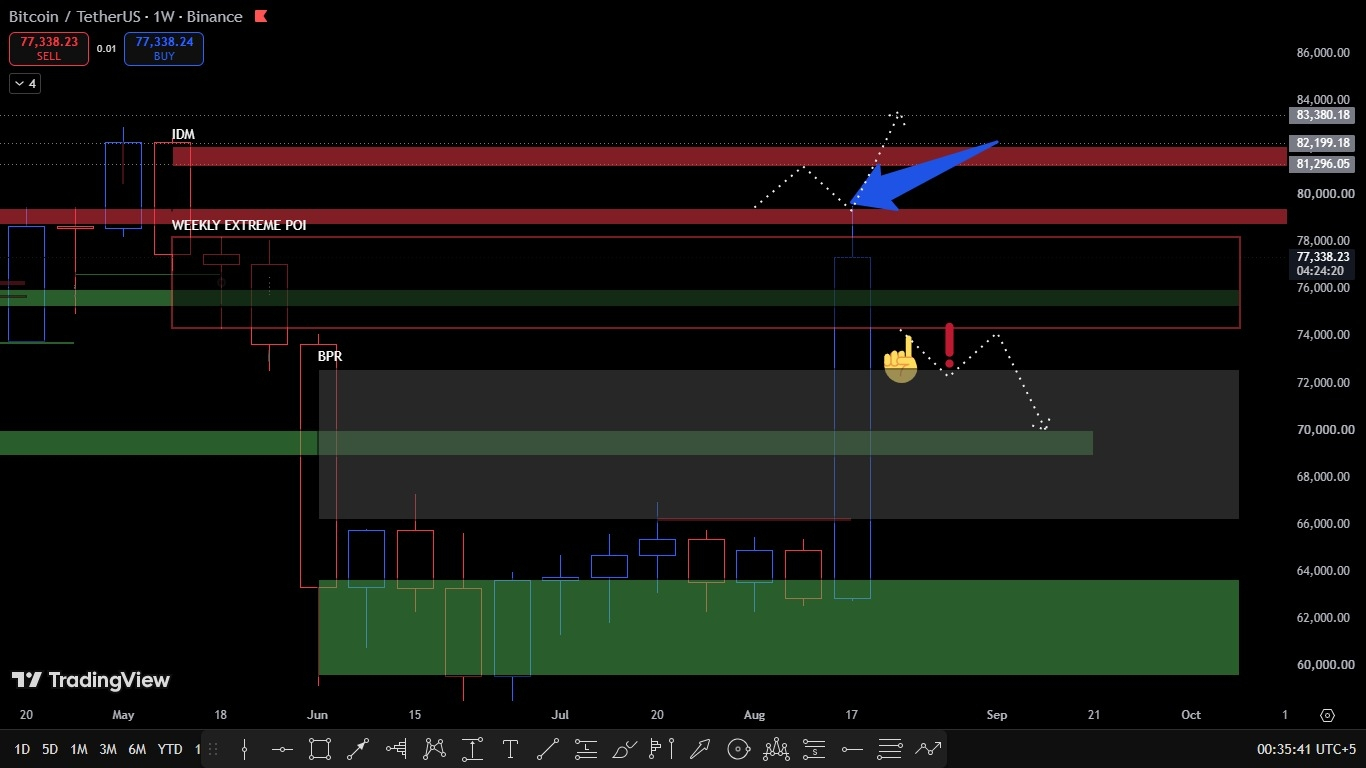
The chart attached to this paragraph show's price action of bitcoin under a weekly timeframe. The current price of Bitcoin (77,361) is showing a test of Bearish supply zone at (78,789) marked as (WEEKLY EXTREME POI) on the chart we still have (4hours) left for a weekly candle close. A weekly candle close above (78,789) (WEEKLY EXTREME POI) will confirm a short term bullishness till (81,207-82,098) marked as (IDM-inducement) on the chart. However for a complete and higher bullish trend we need to close a weekly candle above (82,310). On the other hand if we close a weekly candle bilow (74,292) (bottom of the WEEKLY EXTREME POI) level. Price can dump more till (70,007) to a test a bullish order block aligned with a (BPR-balanced price range) As long as weekly candle is holding above (74,292) thier are alot chances to test (80,000) zone again. Invalidation of the overal bullish trend willbe a weekly candle close bilow (60,000) Demand zone. A dump towards (74k) zone willbe considered a healthy bullish correction to clear the (BPR) and to grab the remaining orders left at (67,334) previous breakout level.
BITCOIN ANALSYS UNDER A DAILY TIMEFRAME.
The chart attached to this paragraph show's price action of Bitcoin under a 1Day time frame. Things are same as the weekly time frame we need a Dailt candle close Above (78,759) (bearish breaker block) to confirm a short term bullishness till (81,290-82,090) Huge bearish barrier zone. A daily candle close bilow (74 308) Weekly extreme POi and Bullish order block will confirm a short term healthy correction to and to grab the remaining pending orders resting at (70,080) previous breakout level aligned with a (BPR) magnet zones. This huge correction willbe only considered as a healthy bullish correction. A wick to the downside (66,301) can also happen just to close the open (BPR) level. Invalidation of the overal bullish trend will only be a candle close bilow (60,000) huge demand zone.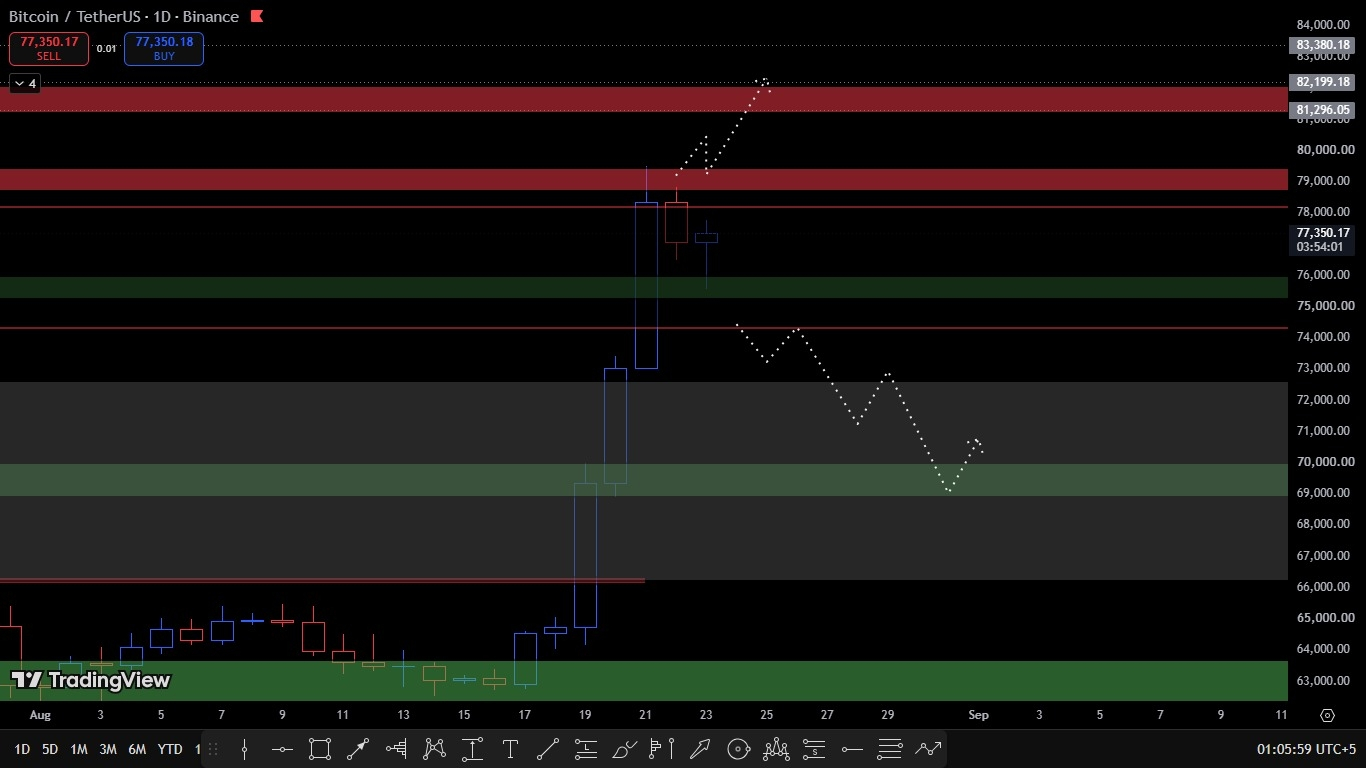
BITCOIN ANALSYS UNDER A 4HRS TIMEFRAME
The charge attached to this explanation show's price action of Bitcoin under a 4hrs timeframe. The chart shows strong SUPPORT AND RESISTANCE levels examined with the (EMA50, EMA20, EMA200, EMA9 and EMA18)
LINES ON THE CHART=
SUPPORT LEVELS AT=
57,776-59,265
64,944-66708
74,648-75,916
RESISTANCE LEVELS AT=
80,878-82,754
Ignoring week support and resistance levels the chart only diplays strong magnet and reppell levels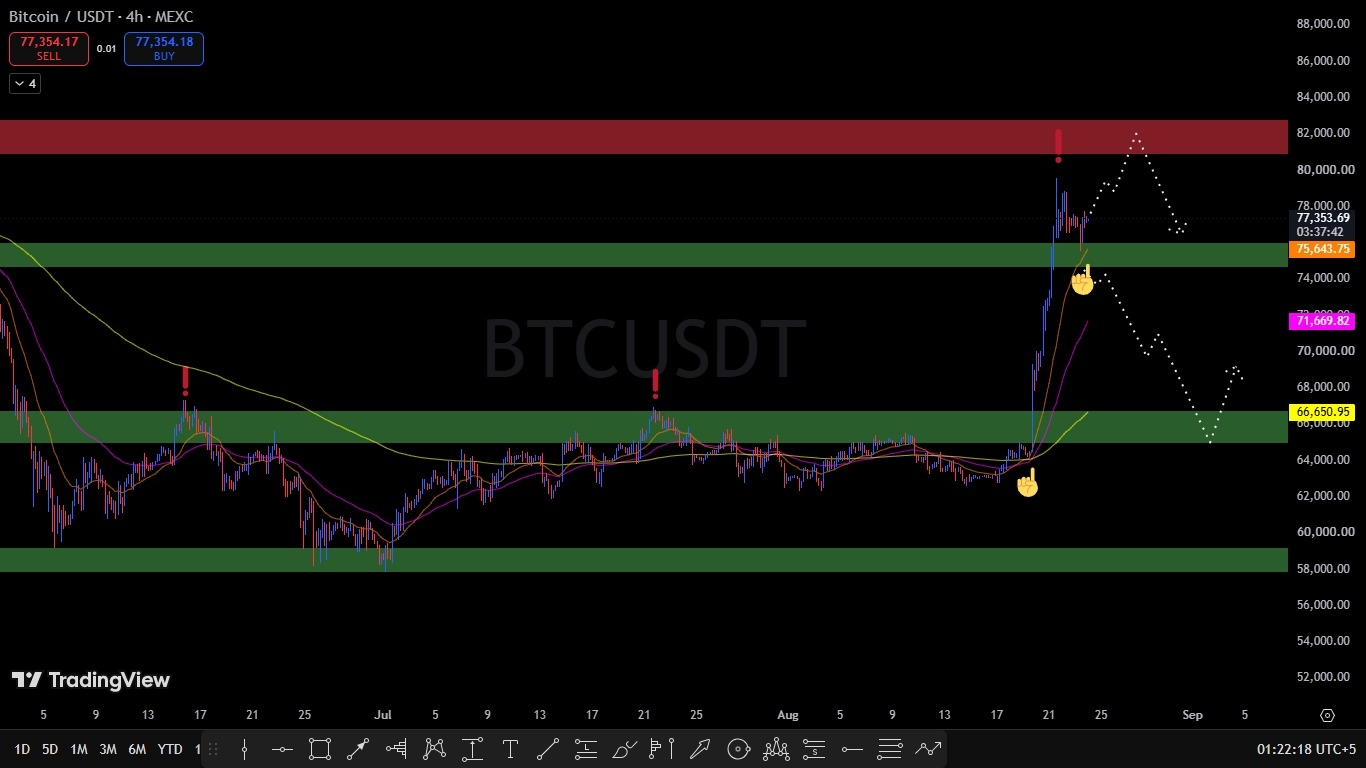
BITCOIN ANALSYS UNDER 1HOUR AND 15mtf
The chart chows price action of Bitcoin analyzed combined under an hourly and 15minutes time frame the chart shows classic (SMC-LIT) concept analsys combines with (ICT). The local breakout level at (77,588) will push the prices towards the bearish breaker block at (78,537) a breakout of the breaker block will confirm another leg up towards (80,760) as long as the prices are above (74, 324) we can expect a pump towards 80k zone respectively. However a breakdown of the BULLISH ORDER FLOW zone at (74,327) will push the prices dump towards (73,027) magnet stoploss (LATE LONGS) levels a successfull liquidation frenzy with a robust bearish volume will push the prices down to (69,925) magnet (FVG) level.also remember if we dont get any weekly or daily candle close above the mentioned zones on Weekly and daily charts we will enter into a new structure which willbe sandwitched in between (80,000-74,000) zone and the market will spend more time in between these two psychological levels keeping this in mind we can take scalp trades in this range bounded zone. Imo this range is perfect for scalp traders a breakout from 80k or breakdown from 74k is not that exciting but once we enter and create a structure in between these two level this willbe a new PAY DAY for bitcoin for us we can spot alot of scalping trades in it. Examine my analsys.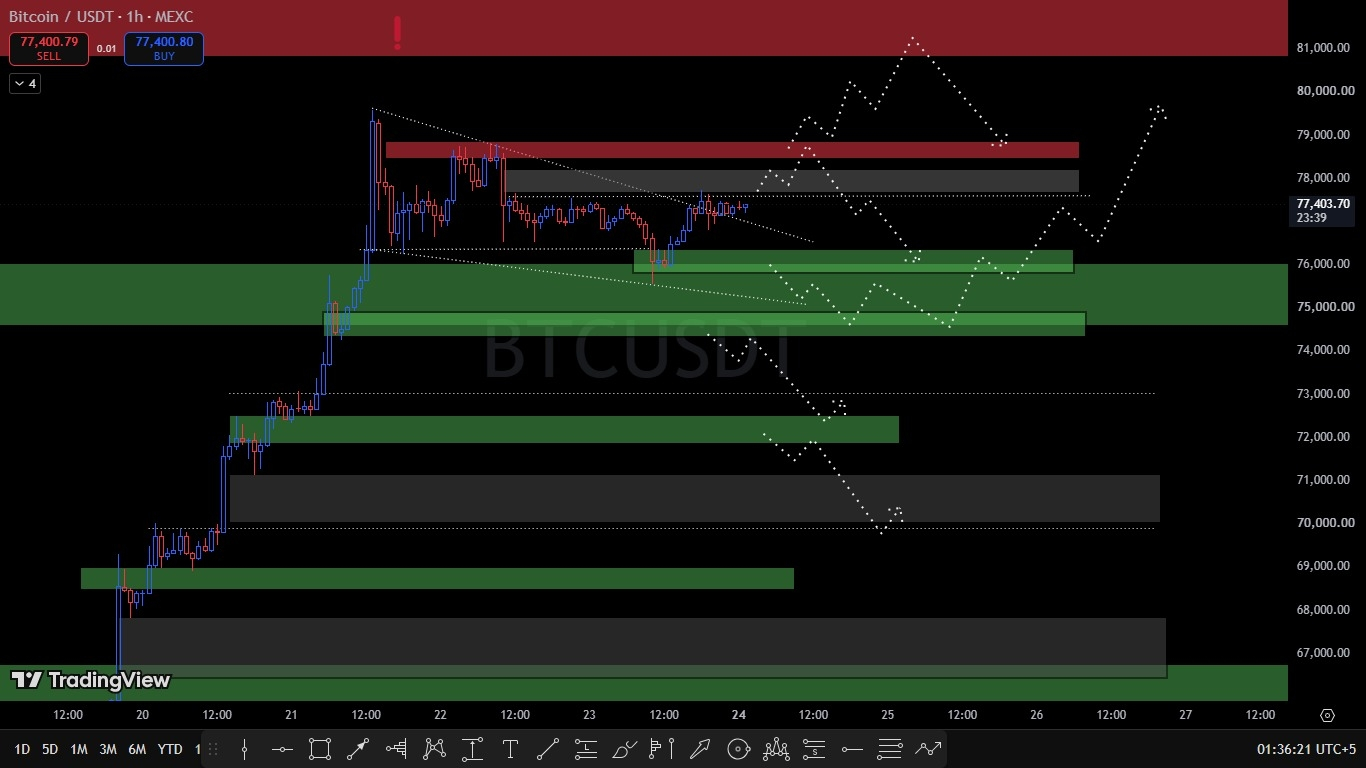
#Write2Earn #trading #BitcoinStrongestWeekSinceMarch2023 #NvidiaAIServerPricesRiseOver15%