


Data Lemah Di Mana-Mana → USD Melemah → Emas Meningkat — Berikut Rincian Lengkapnya*
# 📋 Semua Data Hari Ini Sekilas
| Waktu | Acara/Kegiatan | Aktual | Perkiraan | Sebelumnya | Bias |
| 18:15 | Perubahan Ketenagakerjaan ADP | 9.50K | — | 8.30K | 🟡 Cukup Kuat |
| 18:30 | Indeks Harga Ekspor (MoM) | -1.3% | 0.2% | -0.7% | 🔴 Meleset Ke Bawah |
| 18:30 | Penjualan/Peluncuran Perumahan (MoM) | -12.4% | — | +19.7% | 🔴 Meleset Ke Bawah |
| 18:30 | Penjualan/Peluncuran Perumahan (Total) | 1.239M | 1.340M | 1.415M | 🔴 Meleset Ke Bawah |
| 18:30 | Indeks Harga Impor (MoM) | -0.4% | 0.1% | -0.3% | 🔴 Agak Lemah |
| 18:30 | Izin Bangunan | 1.443M | 1.370M | 1.374M | 🟢 Hanya Mengalahkan |
| 19:15 | Produksi Industri (YoY) | 1.08% | 1.29% | 1.29% | 🔴 Lemah |
| 19:15 | Produksi Industri (MoM) | 0.2% | 0.3% | 0.3% | 🔴 Lemah |
| 20:00 | Penjualan Rumah Tertunda (MoM) | -2.3% | 0.1% | -4.8% | 🔴 Lemah |
| 20:20 | Atlanta Fed GDPNow (Q3) | 4.0% | 4.3% | 4.3% | 🔴 Pertumbuhan Diturunkan |
## 🧠 Aturan Sederhana — Cara Membaca Angka-Angka Ini
- 🟢 **Aktual > Prakiraan** = Ekonomi kuat → USD naik → Emas/Minyak turun
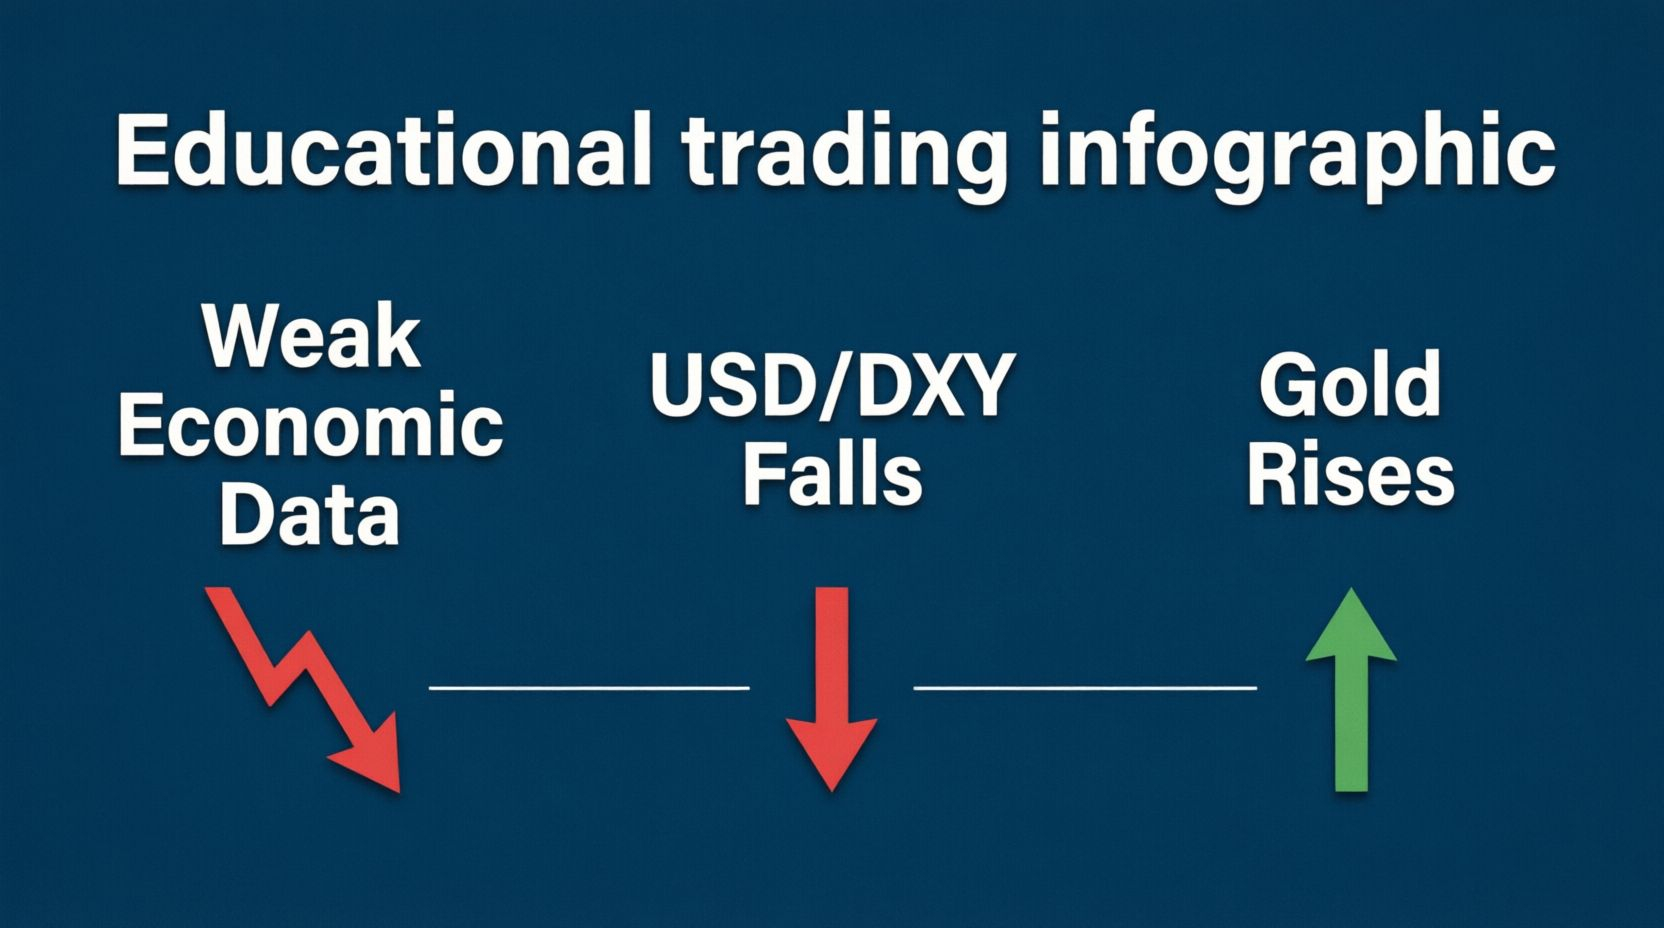
- 🔴 **Aktual < Prakiraan** = Ekonomi lemah → USD turun → Emas/Minyak naik
- 🟡 **Mendekati prakiraan** = Campuran / pergerakan sideways
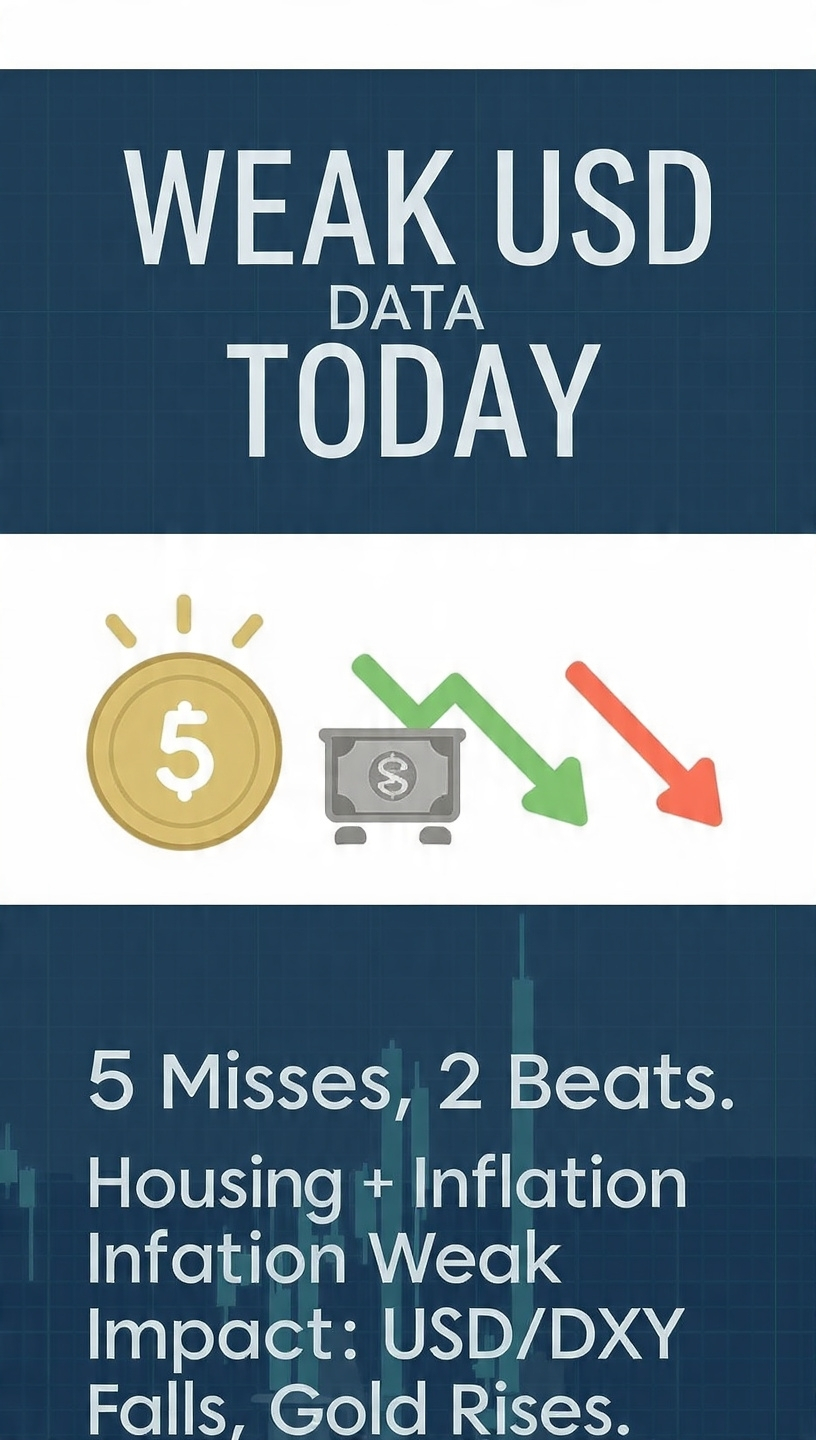
## 📉 Penilaian Hari Ini: Data Lemah di Mana-Mana
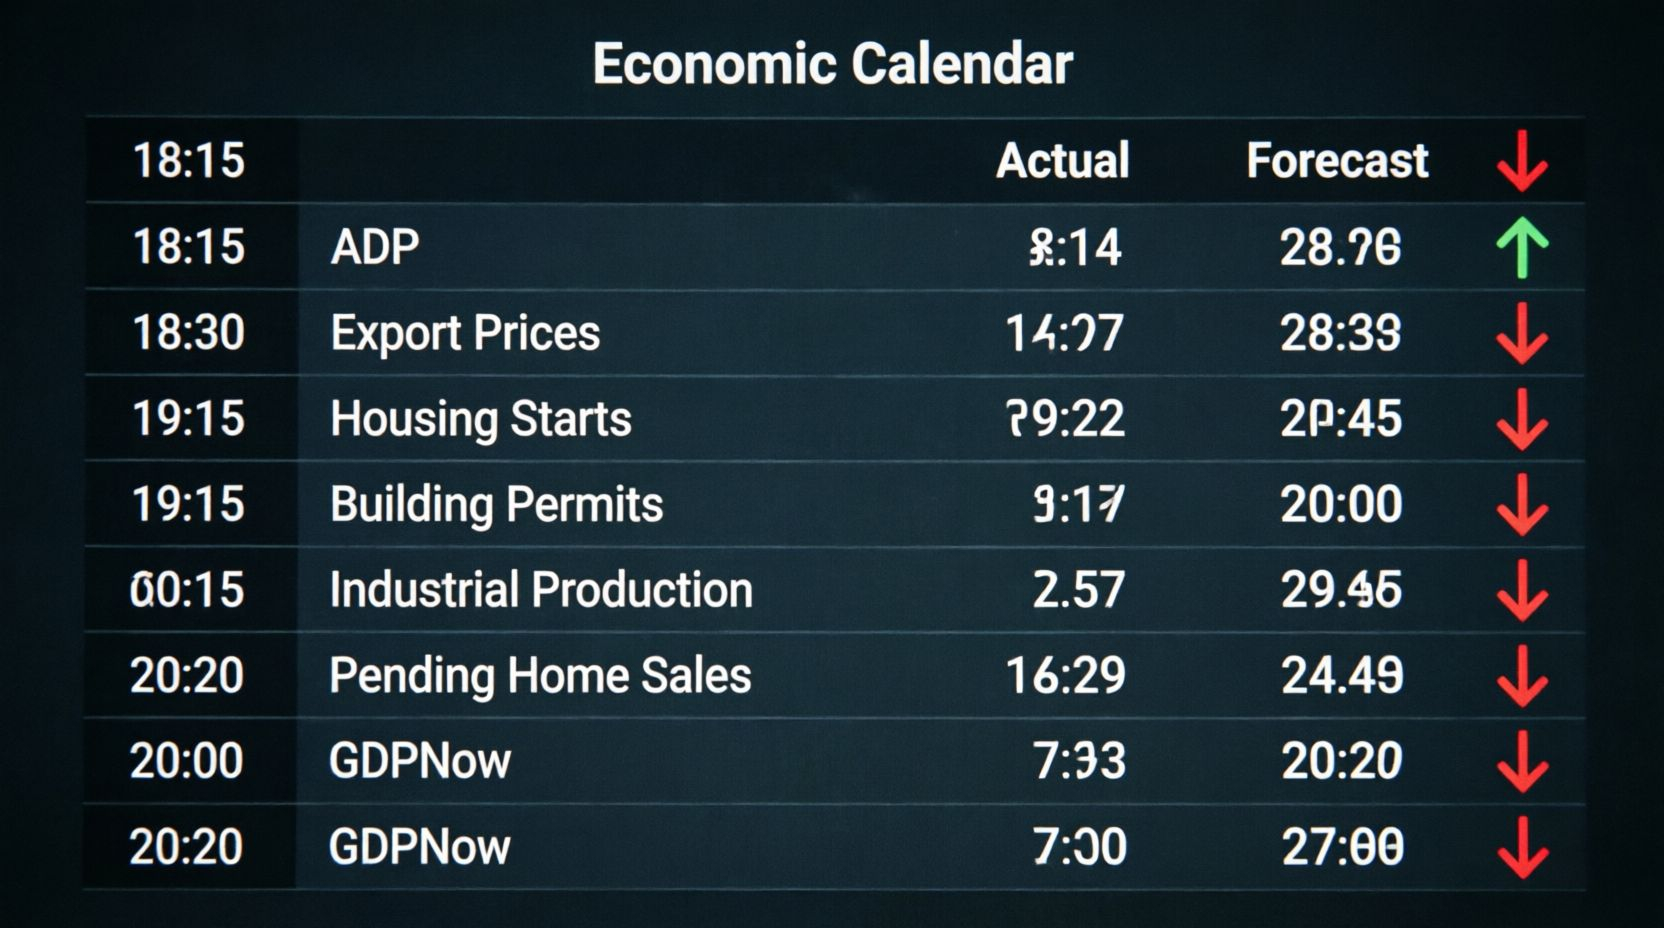
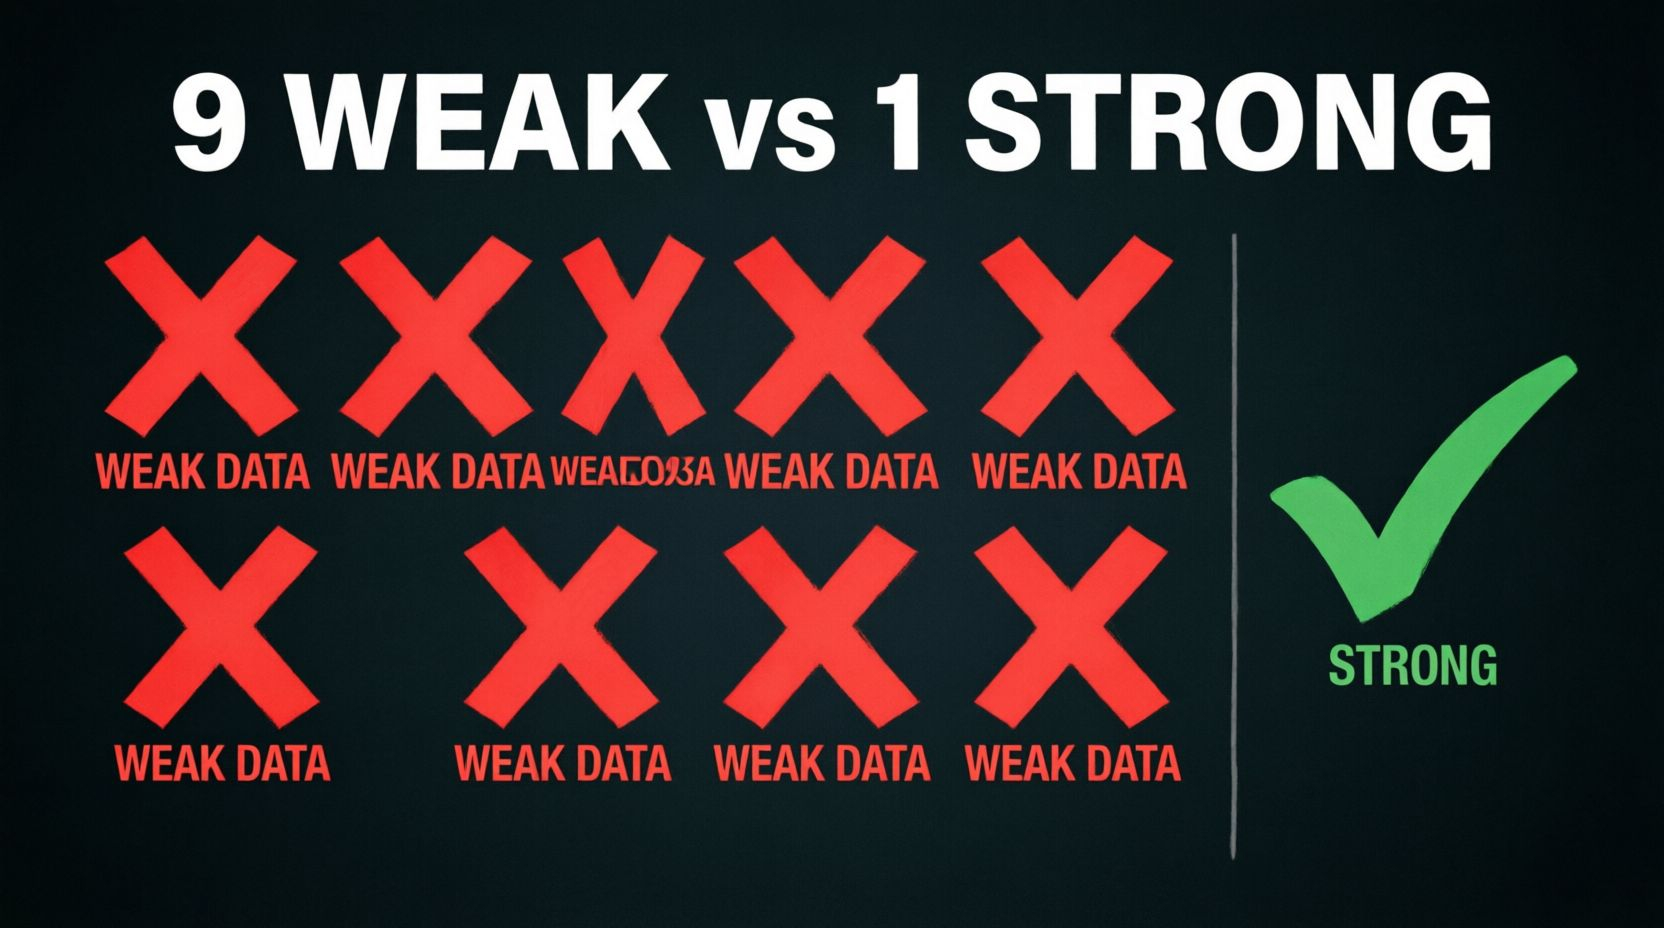
Sembilan dari sepuluh rilis berada di bawah ekspektasi. Hanya Izin Bangunan yang menang — dan itu adalah data perumahan yang melihat ke depan, bukan pertumbuhan saat ini.
- **Harga Ekspor -1.3%** → jauh di bawah prakiraan → pendinginan inflasi → Fed mungkin memotong suku bunga lebih cepat
- **Permulaan Perumahan -12.4%** → penurunan tajam setelah kenaikan bulan lalu → sektor properti melambat dengan cepat
- **Produksi Industri** melemah → manufaktur tidak tumbuh seperti yang diharapkan
- **GDPNow diturunkan menjadi 4.0%** → estimasi pertumbuhan direvisi turun
- **Penjualan Rumah Tertunda -2.3%** → permintaan pembelian rumah melemah
**Intinya:** ekonomi AS menunjukkan tanda-tanda melambat. Pertumbuhan yang lebih lambat biasanya berarti dolar lebih lemah dan emas lebih tinggi.
📸 *Gambar diperlukan: ringkasan dasbor — 🔴 9 rilis lemah vs 🟢 1 kuat.*
---
## 📈 Apa Artinya Untuk Setiap Pasar
### 🪙 Emas → 🟢 Bullish (Naik)
Data lemah → USD turun → emas jadi lebih murah bagi pembeli global → permintaan naik. Pertumbuhan yang lebih lemah juga meningkatkan peluang pemotongan suku bunga Fed yang lebih cepat, yang secara historis mendukung emas.
**Ekspektasi:** emas kemungkinan mendorong ke $4.400+ pada data lemah ini.
### 🛢️ Minyak → ⚖️ Campuran / Sedikit Bullish
Dua kekuatan yang saling berlawanan sedang bekerja:
- ✅ USD lebih lemah → minyak jadi lebih murah → mendukung harga
- ❌ Perumahan lemah, manufaktur lemah, dan data GDP lemah → ekonomi lebih lambat → permintaan bahan bakar lebih sedikit → tekanan
**Ekspektasi:** sideways hingga kenaikan ringan. Perlu data persediaan untuk arah yang lebih jelas.
### 💵 Dolar AS (DXY) → 🔴 Bearish (Turun)
Ketika data secara konsisten meleset dari ekspektasi, para trader memperhitungkan ekonomi yang lebih lemah dan pemotongan suku bunga Fed yang lebih cepat — keduanya bearish untuk dolar.
**Ekspektasi:** DXY berada di bawah tekanan, yang mendukung komoditas secara umum.
: Emas 🟢 Naik, Minyak ⚖️ Campuran, USD 🔴 Turun.*
---
## 🧠 Cara Trading Ini — Rencana Saya
1. **Sebelum rilis:** cek prakiraan — tahu angka mana yang harus diperhatikan.
2. **Saat rilis:** bandingkan aktual vs. prakiraan secara instan.
- Lebih rendah dari prakiraan → beli emas / jual USD
- Lebih tinggi dari prakiraan → jual emas / beli USD
3. **Setelah rilis:** jangan mengejar — tunggu 5–15 menit agar lonjakan awal mereda.
4. **Konfirmasi:** jika dua atau lebih rilis ber-dampak tinggi mengarah ke hal yang sama, pergerakannya memiliki tingkat keyakinan yang lebih besar.
Sembilan rilis yang lemah hari ini mengarah ke bias yang kuat, tapi tetap tunggu pasar menunjukkan arah terlebih dahulu. 🛡️
## ⚠️ Pengingat Penting
- Satu data tidak berarti tren baru — tapi banyak angka lemah yang terkumpul menjadi sinyal kuat.
- USD cenderung bergerak lebih dulu, dengan emas mengikuti — pantau chart DXY bersama berita.
- Pasar bisa berbalik cepat — jika data besok kuat, pergerakan hari ini bisa hilang.
- Selalu gunakan stop-loss — rilis berita menyebabkan lonjakan cepat ke kedua arah.
---
*Ini analisis pribadi, bukan nasihat keuangan. Selalu lakukan riset sendiri. Data ekonomi menciptakan volatilitas — trading dengan manajemen risiko yang tepat.*
**Tag:** #USD #DXY #GOLD #OIL #XAUUSD #EconomicCalendar #NewsTrader #MarketAnalysis
---
## 📋 Checklist Gambar (5 total)
1. Header — kalender + dasbor pasar (1920×500)
2. Tangkapan layar kalender lengkap (dua gambar yang digabung)
3. Infografik aturan sederhana — kuat/lemah → USD → efek pada emas
4. Ringkasan — 🔴 9 lemah vs 🟢 1 kuat
5.
Dampak pasar — Emas naik / Minyak campuran / USD turun
Penafian, ini hanya pendapat saya dan bukan jaminan keamanan finansial; bisa saja terjadi atau tidak terjadi, tetapi ini adalah aturannya.