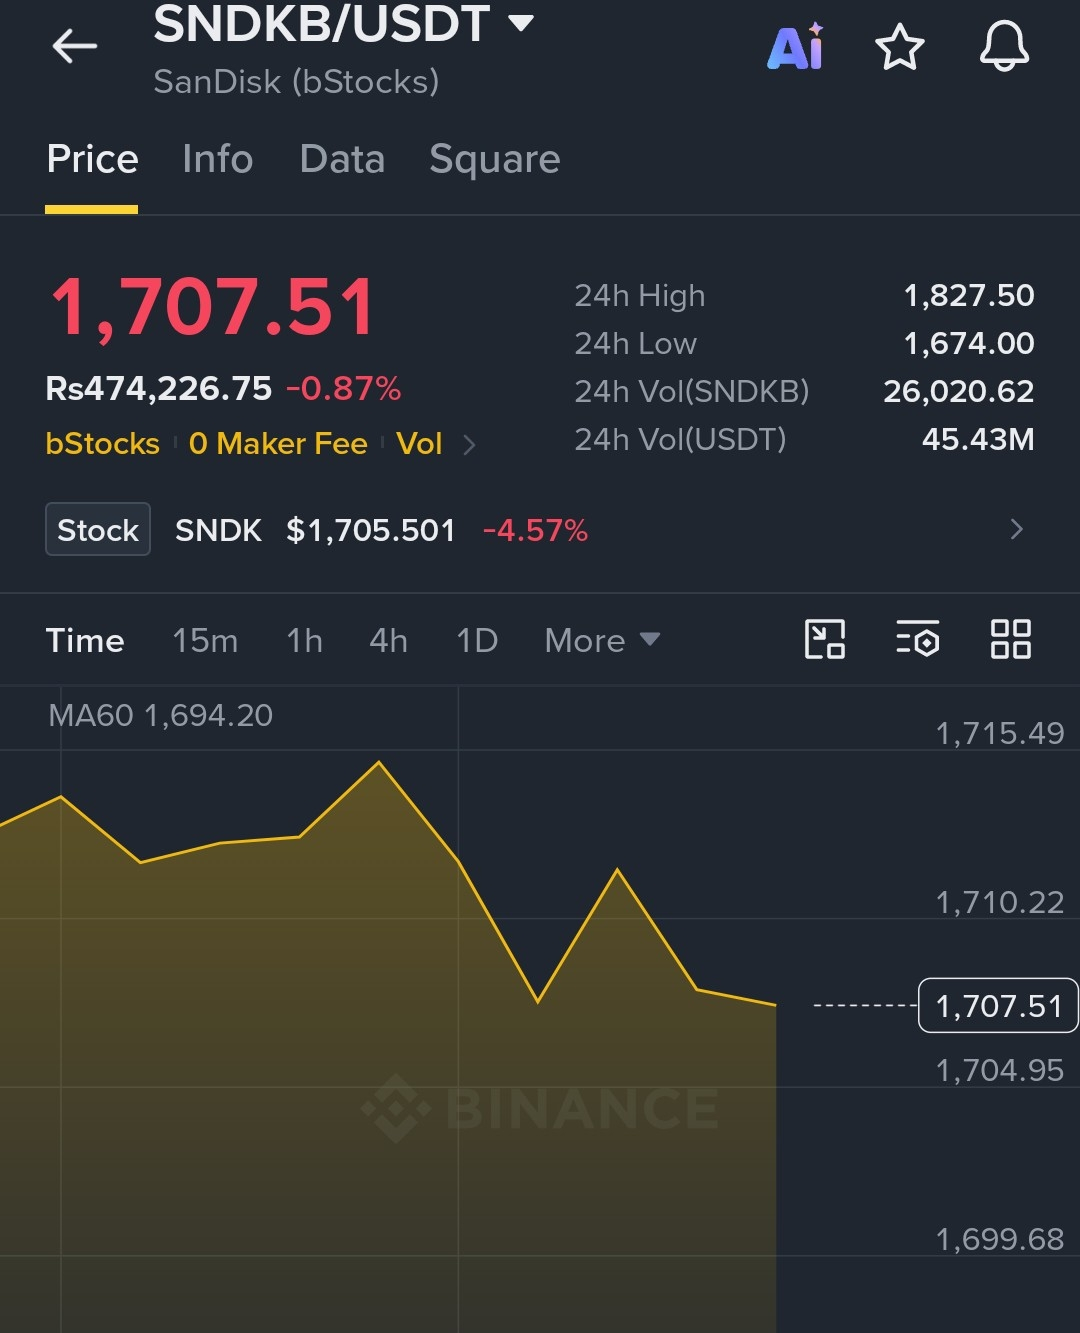
Guys, keep a close eye on $SNDK . After spotting similar setups like $TUT , I’m watching this one for a potential breakdown trade.
The key level on my chart is $1,663 support. If SNDK loses this level cleanly with strong selling pressure and confirms the breakdown, the move could accelerate and open the door toward lower downside zones, with $1,000 being a major level I’m watching.
That said, don’t rush blindly into a short. A breakdown is only meaningful when price confirms it. Failed breakdowns and sharp relief bounces can happen quickly, especially after an aggressive sell-off.
What I’m Watching:
$1,663: Critical support / breakdown level
A clean break and confirmation below support
Increasing selling volume and continued weakness
Lower support zones becoming active after confirmation
Any strong reclaim of the breakdown level as a potential warning sign
If you’re considering a short, focus on confirmation, risk management, and position sizing rather than trying to predict the exact top.
The objective isn’t to catch every move — it’s to take the trade only when the chart confirms the setup.
Stay patient, avoid overleveraging, and protect your capital first. Let price action do the talking.$SNDK