
Kaspa price has spent most of 2026 trapped near levels that few holders expected to revisit. The decline has erased much of the excitement surrounding its earlier rise, although one historical comparison presents a more hopeful possibility.
Crypto MindSet believes Kaspa’s current market structure resembles Bitcoin’s 2014 and 2015 bear market. Bitcoin later escaped that lengthy bottom and entered the powerful rally that defined its 2016 and 2017 cycle.
The comparison does not guarantee that Kaspa will deliver the same result. However, the similarities between both charts create an interesting question. Could the current Kaspa price range represent a prolonged bottom before its next major cycle begins?
Crypto MindSet Compares the Kaspa Price Decline With Bitcoin’s 2015 Bottom
Crypto MindSet explained that Bitcoin entered a prolonged decline after reaching its cycle peak during December 2013. The Bitcoin price continued falling throughout 2014 before reaching a major low during January 2015.
Bitcoin did not begin an immediate recovery from that low. The price moved sideways for several months and returned near its previous bottom during August 2015. That second test created a broad double bottom structure before Bitcoin broke higher during October 2015.
Bitcoin’s main accumulation range stretched from roughly $160 to $300. Buyers who entered within that area endured months of uncertain price movement before the wider recovery became visible.
Crypto MindSet believes the Kaspa price chart has developed a comparable sequence. Kaspa reached its record high during August 2024 before entering a prolonged decline marked by lower highs and lower lows.
The downward trend continued through January 2026. Kaspa then entered a sideways range that has lasted for roughly 8 months. That period resembles the extended consolidation Bitcoin completed before its October 2015 breakout.
Crypto MindSet explained that Kaspa could still revisit the flash crash wick near $0.01. Such a move could produce a double bottom similar to Bitcoin’s 2015 structure. However, the analyst also noted that Kaspa does not necessarily need another decline for the comparison to remain relevant.
Bitcoin’s Recovery Produced the Main Argument Behind the Kaspa Comparison
Bitcoin’s breakout from its 2015 bottom marked the beginning of a much larger recovery. The Bitcoin price eventually advanced by more than 100 times from its lowest levels during the following cycle.
Crypto MindSet used that performance to present a possible Kaspa price scenario. A 100 times increase from Kaspa’s lower range could place KAS near $1, although this remains a highly ambitious projection rather than a confirmed target.
Several conditions would need to align before such a scenario became credible. Kaspa must establish a reliable bottom, break its extended downward structure and attract enough demand to sustain a larger recovery.
Crypto MindSet expects any possible transition to become clearer across the final quarter of 2026 or during 2027. The analyst advised viewers to examine quarterly structures instead of focusing on daily price changes.
The comparison depends mainly on chart structure and market cycle timing. Kaspa remains a much smaller asset than Bitcoin, and both networks developed under very different market conditions. Bitcoin’s earlier performance therefore cannot establish what Kaspa price will do next.
Read Also: XRP Price Near $1.00 as Ripple Expands in Korea and Whale Activity Explodes
Kaspa Still Faces Exchange, Volume and Visibility Barriers
Kaspa has a technically distinct proof of work network, although technical design alone has not produced strong market demand. Several practical weaknesses continue to limit its reach across the cryptocurrency market.
Key obstacles include the following factors:
Low Trading Volume: Kaspa’s daily trading volume frequently remains small compared with its total market capitalization. Major centralized exchanges may have less financial motivation to prioritize the asset when expected trading fees remain limited.
Exchange Integration Effort: Kaspa operates through its own layer 1 proof of work network. Exchanges cannot treat KAS like a standard EVM or Solana token, since supporting the network requires separate technical integration and maintenance.
Marketing and Visibility: Kaspa has received less mainstream promotion than many newer layer 1 networks. Limited visibility can reduce retail awareness even when the underlying technology offers useful features.
Crypto MindSet argued that Kaspa now has broader access through spot markets, futures platforms and decentralized services. However, Kaspa still lacks the global liquidity, institutional presence and infrastructure that Bitcoin had begun to develop before its 2016 recovery.
Those differences make the Bitcoin comparison useful as a chart observation, although they also weaken any direct price projection.
Kaspa Price Must Escape the $0.025 to $0.039 Weekly Range
A look at the Kaspa price chart shows KAS trapped inside a defined weekly range since January 2026. The main boundaries remain near $0.025 and $0.039, and neither buyers nor sellers have secured a lasting break.
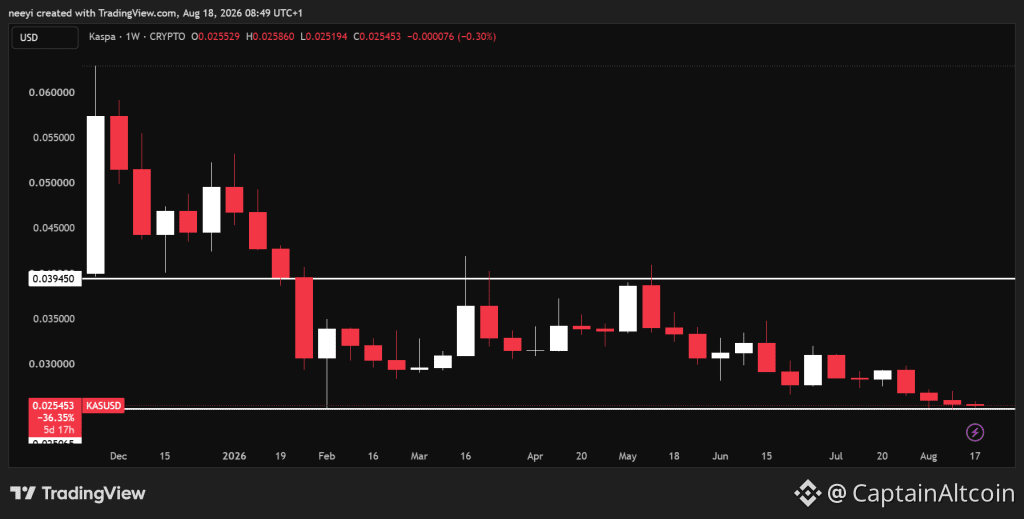 KAS Price Chart / TradingView.com
Kaspa price may continue trading between those levels until stronger demand or a wider market event determines its next direction. The lower boundary near $0.025 remains especially important because it separates the current consolidation from a possible deeper decline.
A weekly break below $0.025 could expose Kaspa price to the previous flash crash area near $0.01. That move would fit the double bottom scenario discussed by Crypto MindSet, although it would also represent a decline of roughly 60% from the range support.
Kaspa needs to reclaim $0.039 before a stronger recovery becomes realistic. A confirmed break above that resistance could open a route toward the higher $0.06 area during the following weeks.
The main price levels are straightforward:
Kaspa Price Level Possible Meaning Below $0.025 Deeper decline toward $0.01 becomes possible Between $0.025 and $0.039 Weekly consolidation remains active Above $0.039 Recovery toward the higher $0.06 area becomes possible
FAQs
Does Kaspa coin have a future?
Kaspa (KAS) has a mixed outlook. Its unique BlockDAG architecture offers high speeds and scalability, but it faces short-term bearish market sentiment with prices hovering around $0.03. Its long-term future depends heavily on ecosystem adoption, ecosystem upgrades like smart contracts, and overcoming heavy competition.
Is Kaspa the next Bitcoin?
No, Kaspa is not the next Bitcoin, though it is a prominent Proof-of-Work (PoW) cryptocurrency designed to fix Bitcoin’s speed limitations using a blockDAG (Directed Acyclic Graph) architecture. While it shares a fair launch and capped supply with Bitcoin, it operates as a distinct technological experiment.
Subscribe to our YouTube channel for daily crypto updates, market insights, and expert analysis.
The post Kaspa Just Repeated Bitcoin’s 2015 Bottom… Here’s What Happened Next appeared first on CaptainAltcoin.