

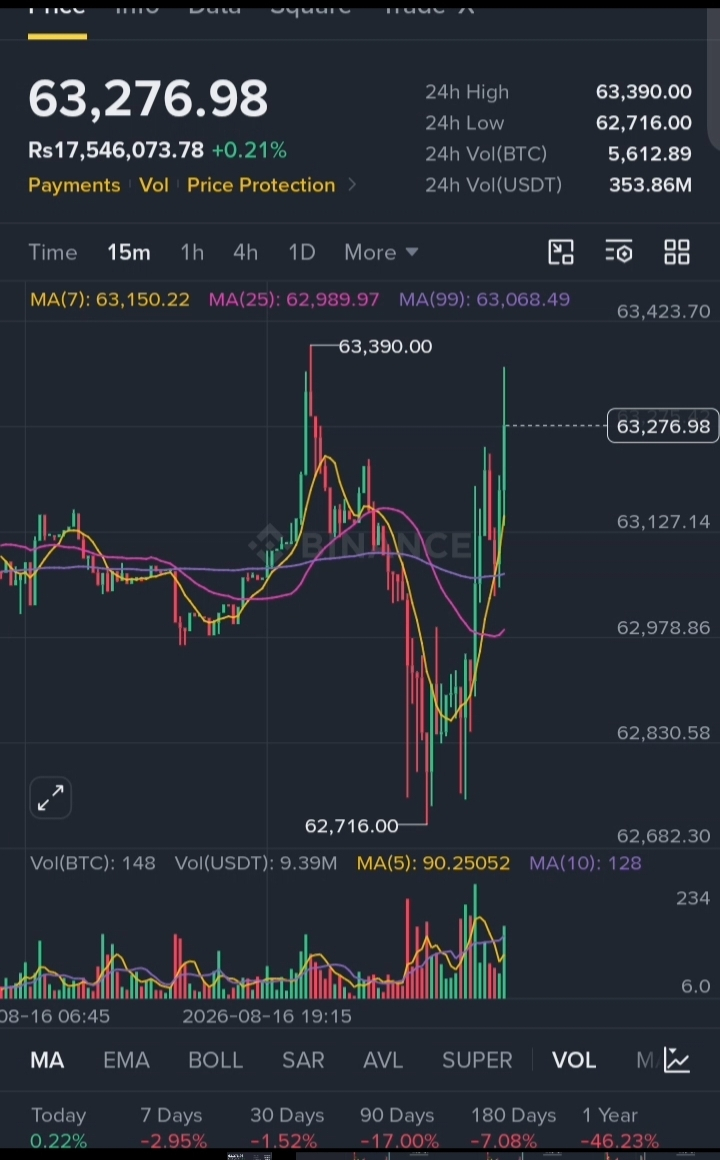
BTC/USDT 15min candlestick chart with the price trading at $63,276.98 (or roughly 17.5 million PKR)
Recent price action:
After touching a 24h high of $63,390 the price experienced a sharp correction toward its 24-hour low of $62,716. This show selling pressure and long liquidation.
However, a significant bullish rejection candle emerged right at the low, creating a V-shaped immediate recovery that pushed the price right back towards $63,200 region.
✍🏼Moving Averages: The short-term MA(7) at $63,150.22 is currently riding above the MA(25) at $62,989 confirming that the bull has absorbed the flash crash and regained immediate micro-trend momentum.
✍🏼Volume and Performance Trends:
A noticeable volume spike accompanied the drop and subsequent bounce signalling strong dynamic support near the $62,700 floor. Despite this short-term bounce (0.22% today) the macroeconomics view remain heavily bearish.
📈 Market Prediction
The extreme long-term negative performance highlights a dominant macro downtrend, meaning local bounces should be approached with caution
📉Bullish Case (Short-term):
If the price maintain structure above the MA (7) $63,150, it is highly likely to retest the local liquidity wall at $63,390. Breaking past this resistance opens up a clear path toward the $63,500 psychological barrier.
📈Bearish Case (Short-term):
Failure to sustain this immediate buying pressure will likely trigger a pullback to test the MA(25) near $62,989. A breakdown past that dynamic level exposes the assets to a deeper retest of the definitive $62,716 structural support floor.
🚨 Follow me to remain updated 💫 💕