

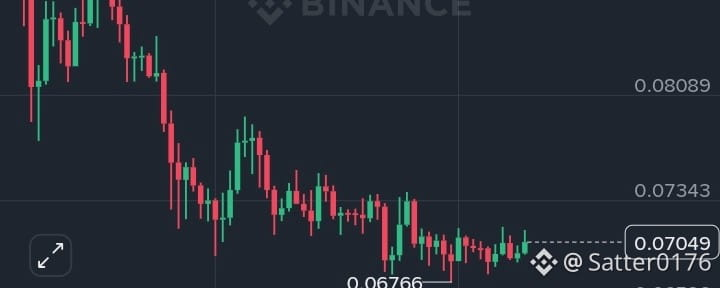

Dogecoin menunjukkan tanda-tanda awal pemulihan setelah tren penurunan yang berkepanjangan, tetapi bull DOGE masih menghadapi ujian besar di depan. 🐕📈$DOGE
Pada chart 1D, DOGE/USDT diperdagangkan di sekitar $0.07049, naik sekitar 1,48% pada sesi terbaru.
📊 Analisis Teknis DOGE
Struktur Pasar:
DOGE masih berada dalam struktur bearish yang lebih luas, tetapi harga mulai bergerak sideways setelah menemukan dukungan di dekat $0.06766.
Level Dukungan:
🟢 $0.06766 — dukungan penting terbaru
🟢 $0.06596 — zona dukungan yang lebih dalam
Level Resistensi:
🔴 $0.07343 — resistensi langsung
🔴 $0.08089 — resistance utama berikutnya
🔴 $0.08835 — target upside yang lebih kuat
RSI (14): 46.7
RSI berada di bawah 50, artinya momentum masih netral hingga bearish. Namun, indikator sedang pulih dari level yang lebih rendah, yang bisa mendukung pantulan jangka pendek.
OBV:
OBV tetap relatif lemah, yang menunjukkan bahwa akumulasi yang kuat belum terlihat. DOGE perlu volume yang lebih kuat untuk mengonfirmasi breakout yang berarti.
🐂 Skenario Bullish
Jika DOGE menembus dan bertahan di atas $0.07343 dengan volume kuat, pembeli bisa menargetkan:
🎯 $0.08089
🎯 $0.08835
Pergerakan yang berkelanjutan di atas $0.08835 akan secara signifikan meningkatkan struktur pasar harian.
🐻 Skenario Bearish
Jika DOGE gagal merebut kembali $0.07343 dan kehilangan $0.06766, pihak penjual bisa mendorong harga menuju $0.06596 dan berpotensi lebih rendah.
🎯 Ide Perdagangan
Zona Entri: $0.0680–$0.0705
Stop Loss: Di bawah $0.0655
TP1: $0.0734
TP2: $0.0809
TP3: $0.0883
⚠️ Bukan nasihat keuangan. DOGE sangat volatil. Konfirmasikan breakout dengan volume dan selalu kelola risiko Anda.
Kamu lebih bullish atau bearish untuk DOGE dari sini? 🐕🔥