

SOLUSD — Solana / U.S. Dollar SOLUSD : 1-Hour Intraday Technical Outlook
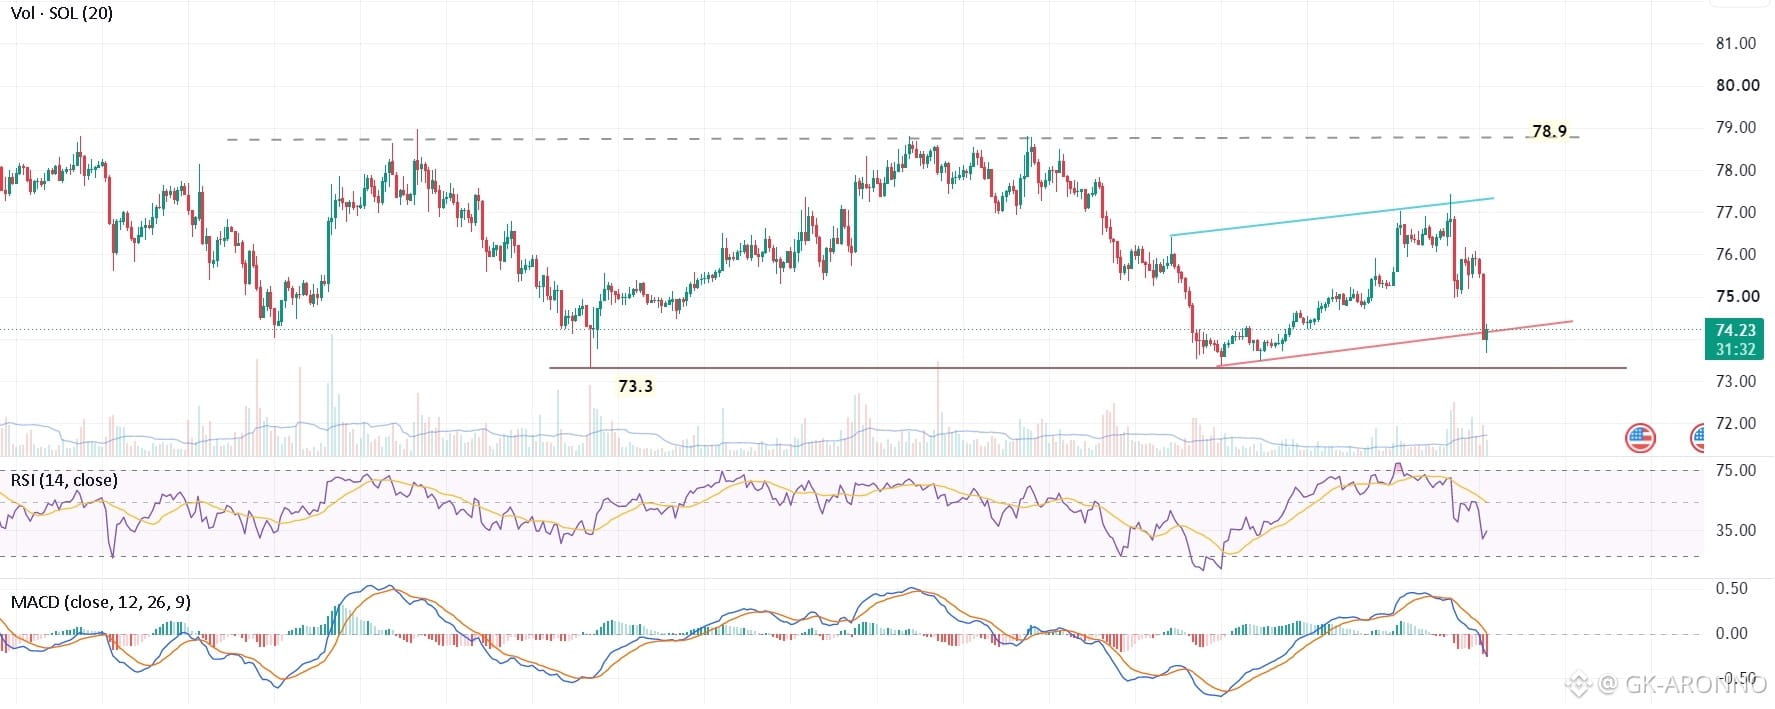
Solana (SOL) is testing a crucial intraday decision zone on the 1-hour timeframe following a sharp rejection from its recent bounce high. The price is hovering around $74.18, sitting right near an ascending support trendline and just above key horizontal support at $73.30.
Below is a detailed breakdown of the technical setup, key levels, and actionable intraday trading scenarios.
---
1. Price Action & Structural Breakdown
Rising Wedge / Ascending Support Breakdown: SOL experienced a steep pullback after tapping resistance near $77.50 (bounded by the upper cyan trendline). It is currently breaking below its short-term ascending trendline (red support line).
Critical Floor ($73.30): A horizontal support zone highlighted near $73.30 (brown line) serves as the primary line of defense. A breakdown below this level completes a local lower-low structure.
Macro Range Resistance ($78.90): Overhead supply remains capped at the strong horizontal resistance zone around $78.90 (dashed grey line), which rejected price advances multiple times between July 21 and July 23.
---
2. Technical Indicators Analysis (1H Timeframe)
Relative Strength Index (RSI - 14):
RSI Value: Sits in bearish territory at 33.81 (below its signal line at 49.71).
Oversold Conditions: Nearing oversold territory (< 30), suggesting immediate downward momentum is stretched and a short-term bounce or consolidation could be near.
MACD (12, 26, 9):
MACD Line / Signal: Crossed below zero with the MACD line at -0.25 vs signal line at -0.25.
Histogram: Printing expanding red bars, reflecting accelerating short-term bearish momentum.
Volume Profile: Volume picked up during the latest red hourly candle, indicating increased selling pressure near the breakdown point.
---
3. Key Levels to Watch
Immediate Support: $73.30
Secondary Support / Invalidation Target: $71.50 – $72.00
Immediate Resistance (Breakout Retest): $75.20 – $75.50
Secondary Resistance: $77.50
Major Range Ceiling: $78.90
---
4. Actionable Trading Scenarios
Bearish Scenario (Breakdown Continuation):
A clear hourly candle close below $73.30 confirms a breakdown out of the recent consolidation, opening the path to deeper intraday targets.
Entry: Short on a confirmed hourly close below $73.30 or on a weak retest of $75.00.
Target 1: $72.00
Target 2: $70.50
Stop Loss: Above $75.50
Bullish Scenario (Support Hold & Rebound):
If buyers defend the $73.30 horizontal support and reclaim the lost trendline above $75.20, a relief rally back toward the recent swing highs is expected.
Entry: Long on a bounce confirmation at $73.30 with an RSI bullish divergence, or upon reclaiming $75.20.
Target 1: $76.80
Target 2: $78.90
Stop Loss: Below $72.80
---
Summary:
SOL/USD is at an intraday tipping point. A hold above $73.30 could allow for an oversold bounce, but failure to hold this horizontal support will likely trigger an acceleration toward $72.00 and lower.
