
Observations:
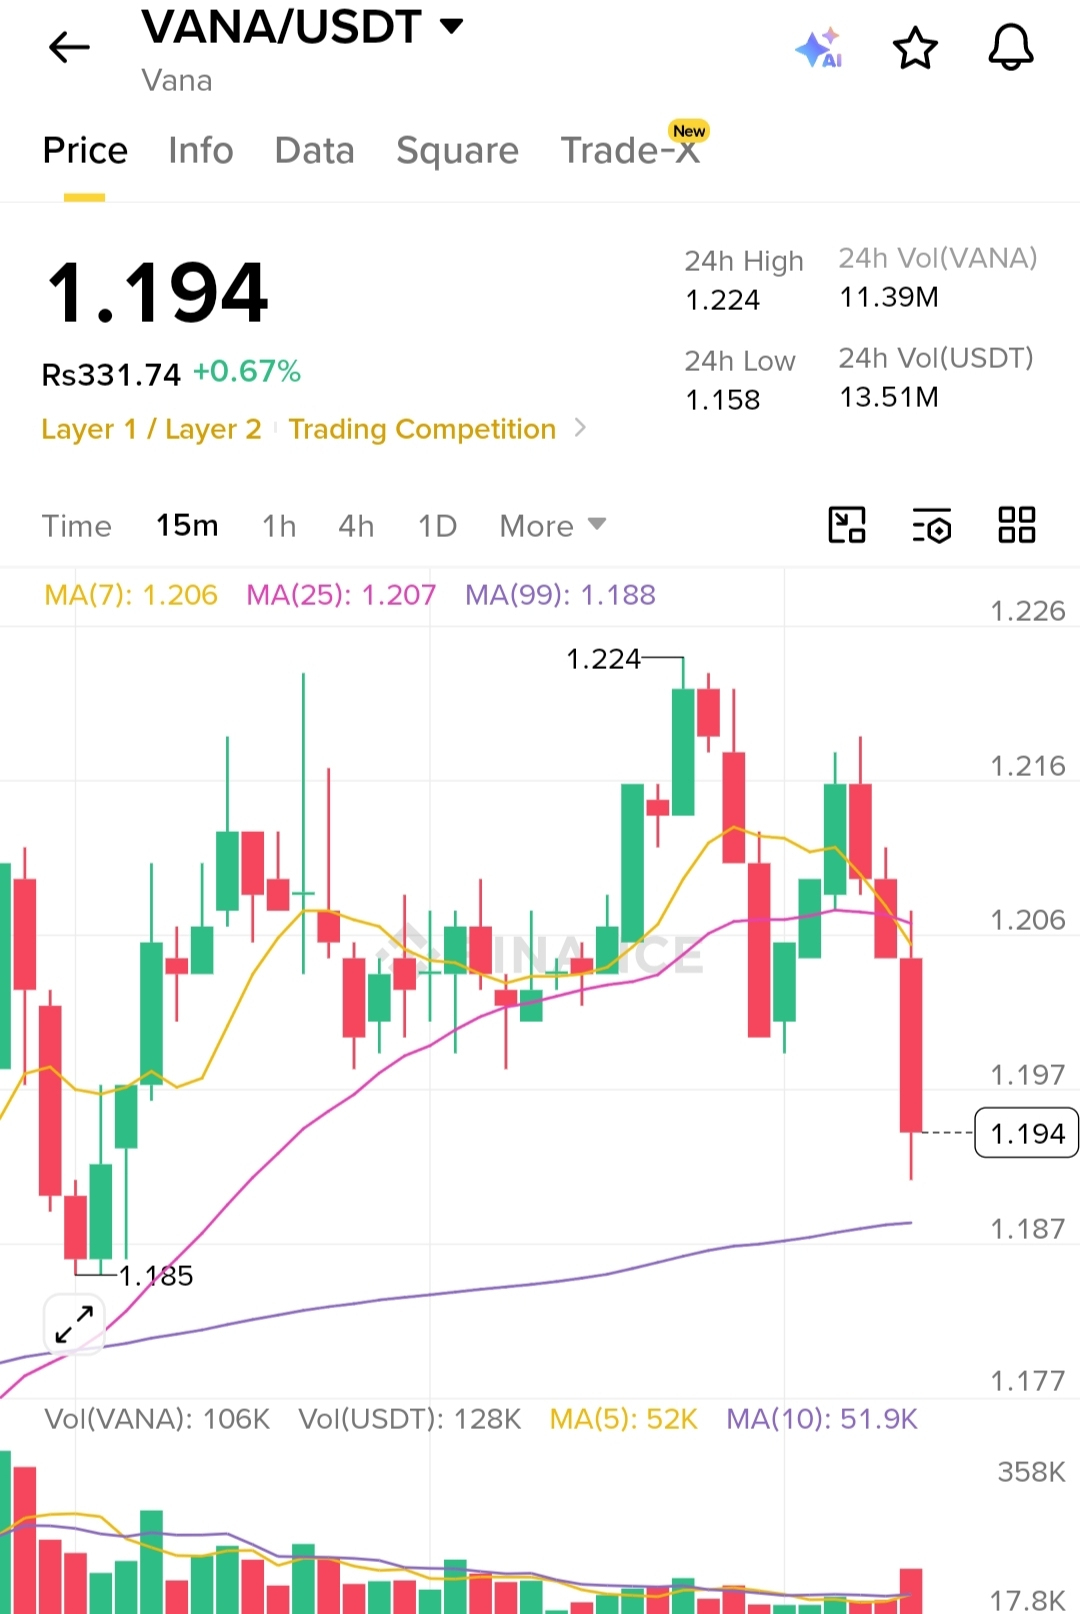
🔴 Price is 1.194, after being rejected from 1.224 (today's high).
🔴 The latest candle is a strong bearish candle with higher selling volume, showing sellers are currently in control.
🔴 MA(7) = 1.206 and MA(25) = 1.207 are both above the current price, which is a bearish sign.
🟣 MA(99) = 1.188 is acting as the nearest major support.
Key Levels
Resistance: 1.205–1.208
Major Resistance: 1.220–1.224
Support: 1.188
Next Support: 1.180
Trading Plan
📉 Short Trade (Higher Probability)
Entry: 1.202–1.206 on a weak bounce
Stop Loss: 1.212
Take Profit 1: 1.188
Take Profit 2: 1.180
Bullish Scenario:
If VANA closes back above 1.208 with strong buying volume, the bearish setup weakens and price could retest 1.220–1.224.
Overall View
I would currently rate this chart:
Bearish: ⭐⭐⭐⭐☆ (4/5)
Long setup: Wait for confirmation; don't buy into the current selloff unless price reclaims resistance with volume.

Since this is only a 15-minute chart, confirm the trend with the 1-hour and 4-hour charts before entering a futures position.