

Coin name- $BTC
Signal type- LONG

BTCUSDT
Perp
63,216.4
+0.37%
today I will explain why do I think $BTC can pump hard to the upside with proper on chain data analysis and technical analysis
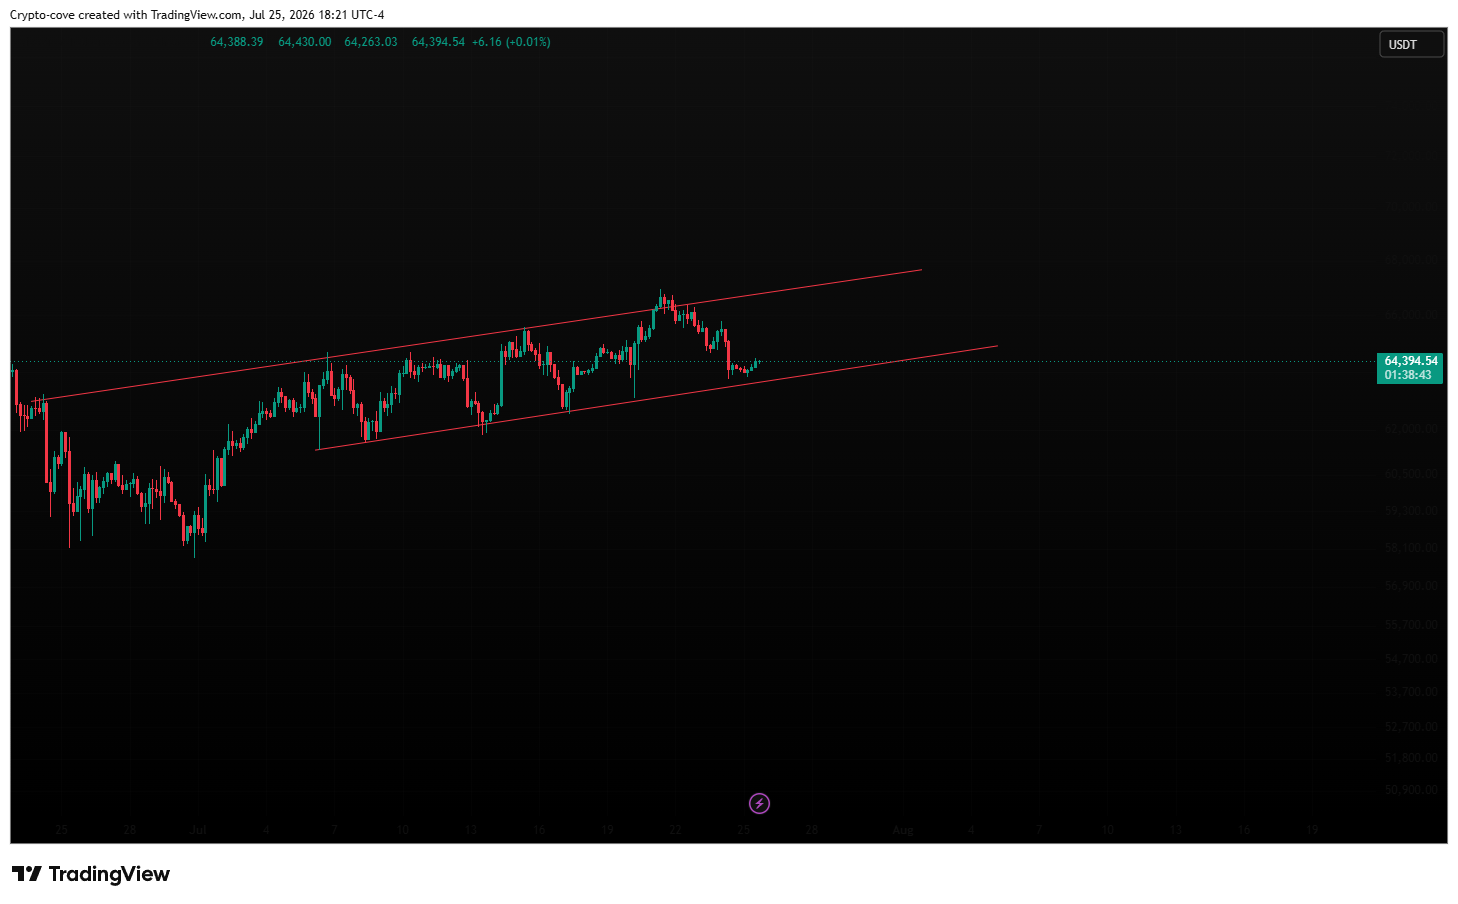
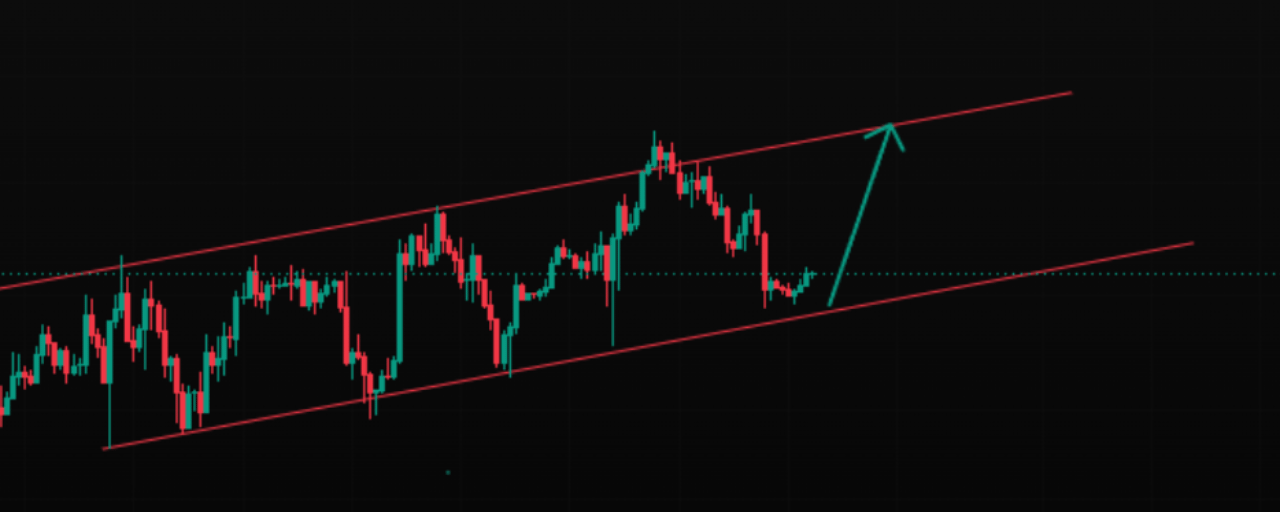
as you can see in my added photo $BTC is following a channel perfectly... It respecting it's resistance line and support line... Right now BTC is holding trendline support so that I am expecting it will pump again to retest it's resistance line... must remember if btc failed to hold this support trend will chance to the downside...
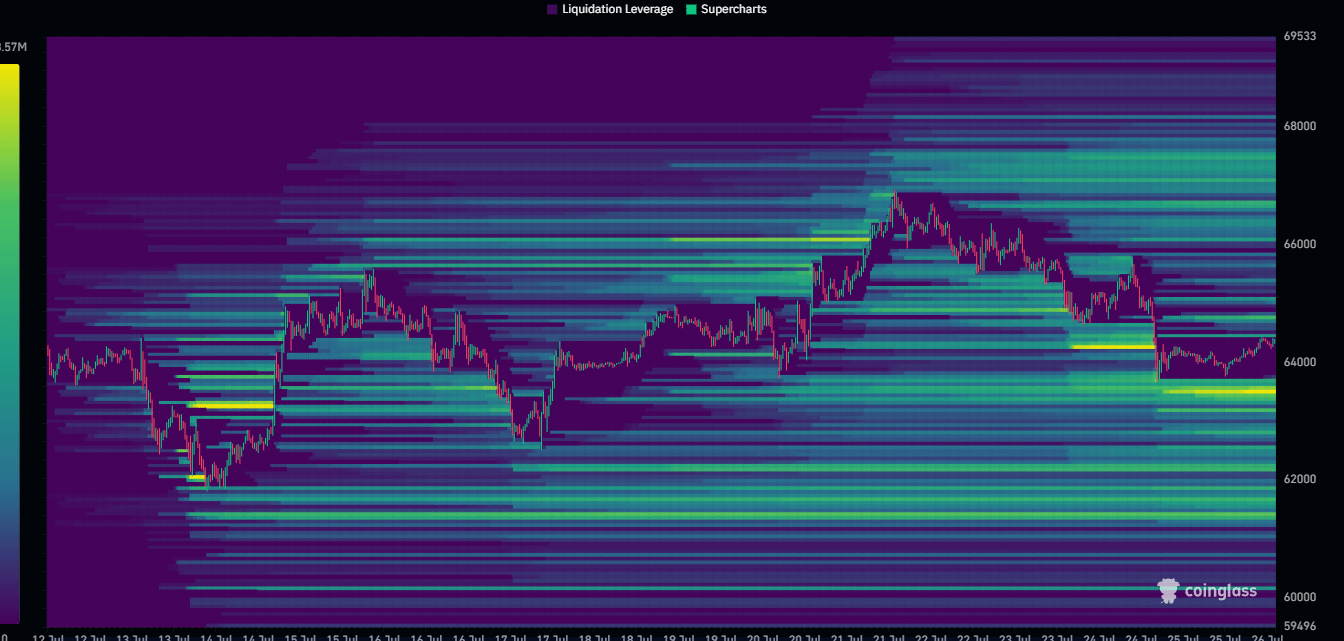
as you can see liquidation heat map showing $btc created massive liquidity to the upside 64500-67400 level... If btc holds 63700 range it will take short trader liquidity....
Entry price- 63700-64300
leverage 15x
1st tp- 65500
2nd tp- 67000
SL- 63000