
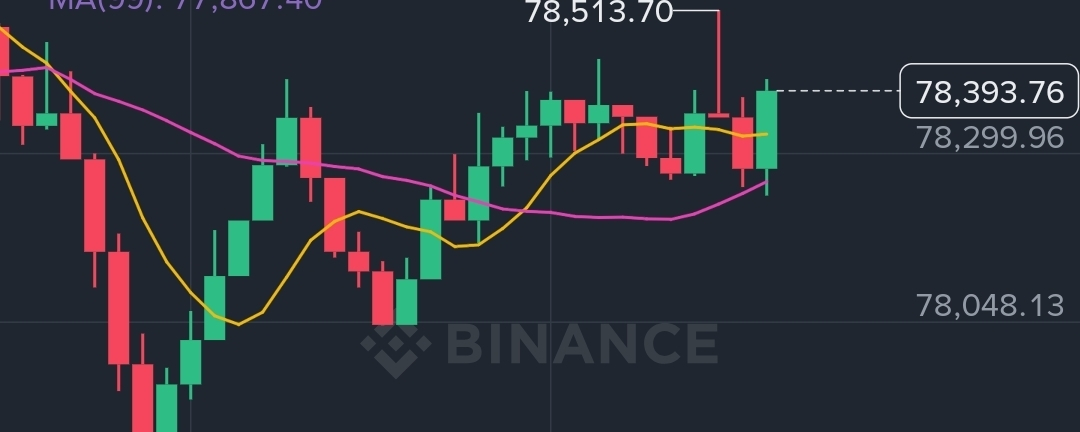

Trend: BTC has been in a long-term uptrend since late 2023, driven by ETF inflows and institutional demand.
Cycle context: Still behaving like a post-halving bull phase (after the April 2024 halving), but with periodic sharp pullbacks.
Volatility: Elevated—large swings are normal, not a signal by themselves.
🔍 Key Technical Levels
Think of these as zones traders watch:
Resistance (sell pressure):
Previous all-time high zone
Psychological round numbers (e.g., 70k, 80k, etc.)
Support (buy interest):
50-day moving average (short-term trend)
200-day moving average (major trend)
Prior breakout levels
If BTC holds above support → bullish continuation
If it breaks below with volume → deeper correction likely
📈 Indicators (Simplified Read)
RSI (Relative Strength Index):
Above 70 → overbought (possible pullback)
Below 30 → oversold (possible bounce)
Moving Averages:
Price above 200-day MA → macro bullish
Golden cross (50 > 200) → strong signal
Death cross → caution
Volume:
Rising price + rising volume = strong move
Rising price + weak volume = fragile rally
🧠 Fundamentals Driving BTC
Institutional money (ETFs, funds)
Supply shock from halving (reduced new BTC issuance)
Macroeconomics (interest rates, inflation)
Regulation news (can swing sentiment fast)
⚠️ Risks to Watch
Sudden macro shocks (rate hikes, liquidity tightening)
Regulatory crackdowns
Over-leveraged markets (liquidation cascades)
🧭 Short-Term Outlook (Typical Scenario)
Bull case: Higher highs continue if support holds → trend intact
Bear case: Break below major support → correction toward deeper levels
Neutral: Sideways consolidation (very common after big moves)
Bottom Line
Bitcoin is still structurally bullish—but not in a straight line. Expect volatility, fakeouts, and corrections even in strong trends.
If you want, tell me:
your timeframe (day trading, swing, long-term)
or current BTC price you're looking at
…and I’ll give you a more precise, trade-style analysis with entry/exit zones.