
Gold Technical Analysis $XAU (XAU/USD M15 Chart) - April 14, 2026Chart Observations
•Timeframe: M15 (15-minute chart).
•Current Price: Approximately 4775.27 (as shown in the price tag).
•Trend: Bullish. The chart shows a clear uptrend with higher highs and higher lows.
•Trendline: A red ascending trendline is drawn, providing dynamic support.
Price is currently trading above this trendline.
•Support Levels:
•Immediate Support: 4772.00 - 4775.00 (Current consolidation area).
•Major Support Zone: 4763.00 - 4765.00 (Red horizontal box).
•Trendline Support: Intersects around 4768.00 - 4770.00.
•Resistance Levels:
•Immediate Resistance: 4776.38 - 4778.00 (Red horizontal box).
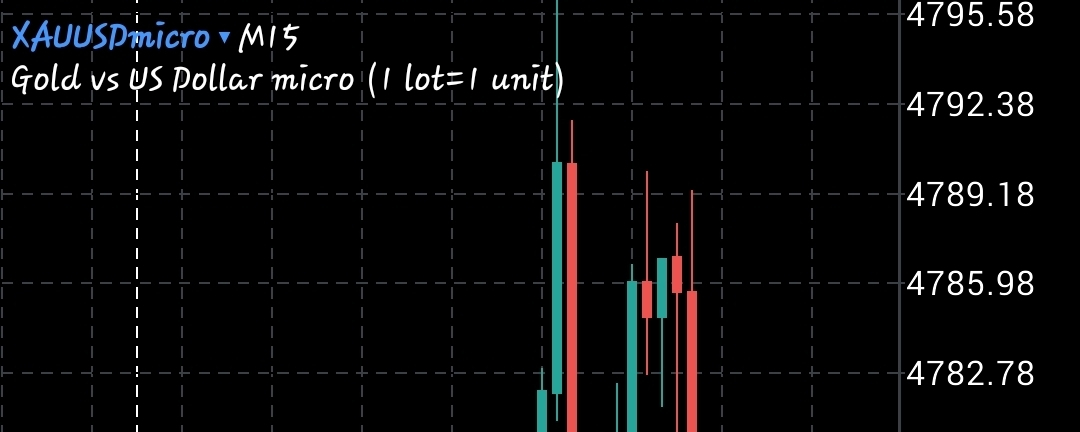
•Recent High: 4795.58 (Top of the chart).
•Psychological Level: 4800.00.
Price Action
•The price recently broke above the 4776.38 resistance zone but has pulled back to retest it as support.
•A strong bullish impulse move occurred from 4763.00 up to 4795.58.
•The current pullback is finding support near the previous resistance zone (4775.00 - 4776.00).
•Candlestick patterns show some rejection at the 4795.58 level (long upper wicks), indicating selling pressure at higher levels.