

#meanreversionplay
meanreversionplay
459 penayangan
5 Berdiskusi
Populer
Terbaru

Lihat terjemahan
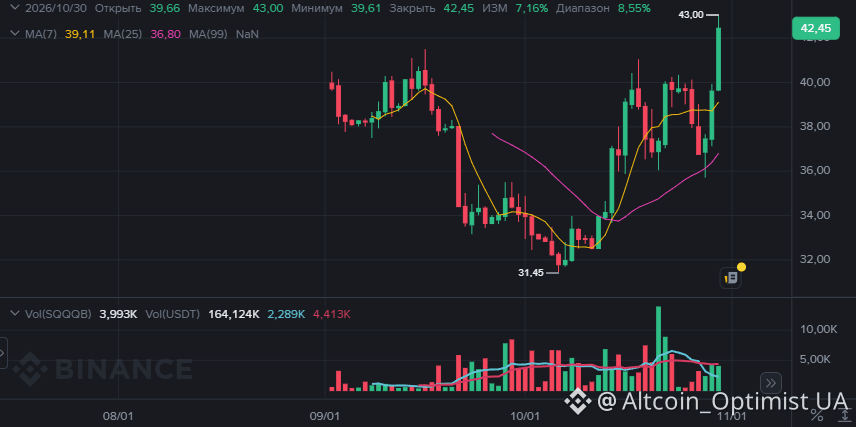
$SQQQB : Up nearly 16% in a few sessions — is a pullback next?
I’m watching a SHORT setup on SQQQB after its sharp upside acceleration.
SQQQB is a tokenized bStock linked to ProShares UltraPro Short QQQ. The underlying ETF targets −3x the Nasdaq-100’s daily performance. That means shorting SQQQB is effectively a bet on a Nasdaq rebound after the recent technology sell-off.
Following the market reaction to major tech earnings, SQQQB moved sharply higher. Based on the daily candles, it gained around 7% on October 30 and reached 43.00. From 36.60 to 42.45, the move has approached 16% in just a few sessions.
I’m not chasing that momentum. I’m looking for a mean-reversion move: price has stretched well above its short-term averages, RSI is approaching 70, and 36.50 sits near a previous support area.
My trade setup:
SHORT entry: 42.00
Take profit: 36.50
Stop loss: 43.375
Reward/Risk: 4:1
The potential gain is approximately 13.1%, against 3.27% risk. With this payoff structure, only about 20% winning TP/SL outcomes are needed to break even before fees: one successful target can offset four stopped trades.
I estimate the probability of hitting TP before SL at around 40% over the next 10 trading sessions.
This is a defined-risk pullback setup, not a prediction that every market move will reverse.
Open $SQQQB and watch the 43.00 level: another breakout, or the start of a cooldown?
#MeanReversionPlay #swingtrading #RiskManagement
64

Strategi Trading - Setup Mean ReversionStrategi Mean Reversion - Metode Trading yang Terbukti
Salah satu strategi trading yang paling andal di crypto adalah mean reversion. Jika kamu bisa menguasai pendekatan ini, kamu akan menangkap beberapa peluang trading terbaik dengan risiko yang terdefinisi.
**Apa itu Mean Reversion?**
Mean reversion didasarkan pada prinsip sederhana: Ketika sebuah aset bergerak terlalu jauh dari rata-ratanya, ia cenderung kembali ke rata-rata tersebut. Ini terjadi terus-menerus di crypto.
Contoh: Jika rata-rata 20 hari Bitcoin adalah $45,000 dan BTC turun ke $40,000 (penurunan berlebihan), trader mean reversion mengharapkan adanya rebound kembali ke $45,000.
Strategi Trading - Setup Mean Reversion
Strategi Mean Reversion - Metode Trading yang Terbukti
Salah satu strategi trading yang paling andal di crypto adalah mean reversion. Jika kamu bisa menguasai pendekatan ini, kamu akan menangkap beberapa peluang trading terbaik dengan risiko yang terdefinisi.
**Apa itu Mean Reversion?**
Mean reversion didasarkan pada prinsip sederhana: Ketika sebuah aset bergerak terlalu jauh dari rata-ratanya, ia cenderung kembali ke rata-rata tersebut. Ini terjadi terus-menerus di crypto.
Contoh: Jika rata-rata 20 hari Bitcoin adalah $45,000 dan BTC turun ke $40,000 (penurunan berlebihan), trader mean reversion mengharapkan adanya rebound kembali ke $45,000.
1
91
Masuk untuk menjelajahi konten lainnya
Bergabunglah dengan pengguna kripto global di Binance Square
⚡️ Dapatkan informasi terbaru dan berguna tentang kripto.
💬 Dipercayai oleh bursa kripto terbesar di dunia.
👍 Temukan wawasan nyata dari kreator terverifikasi.
Email/Nomor Ponsel
Topik Sedang Tren
1
#BinanceRecovery90% of stolen assets
2,620 penayangan
51 Berdiskusi
2
#YiHe:ProofOfReserves:10TokensAt100%Backing
15,690 penayangan
74 Berdiskusi
3
#BackedNotBroken:RichardTengSaysUsersBearNoLoss
53 penayangan
29 Berdiskusi
4
#CZSaysCompensationIsinPlaceUsersAreProtected
60,363 penayangan
816 Berdiskusi
5
#IntelHasItsWorstDaySince1974
13,034 penayangan
329 Berdiskusi
6
#TRMCambodianCasinosReceived$1.07BInCrypto
2,882 penayangan
53 Berdiskusi
7
#USDCCirculationFallsAbout800MInSevenDays
32,692 penayangan
500 Berdiskusi
8
#SuspectedNorthKoreaAttacksAccountForNearly89%OfCryptoHackLosses
9,592 penayangan
77 Berdiskusi
9
#OpenAICutsFundraisingTargetBy$10B
2,247 penayangan
61 Berdiskusi
10
#ASICHasReceivedNoPredictionMarketApplications
44,419 penayangan
915 Berdiskusi