

#liquidationmap
liquidationmap
398,236 penayangan
861 Berdiskusi
Populer
Terbaru
·
--
Bullish
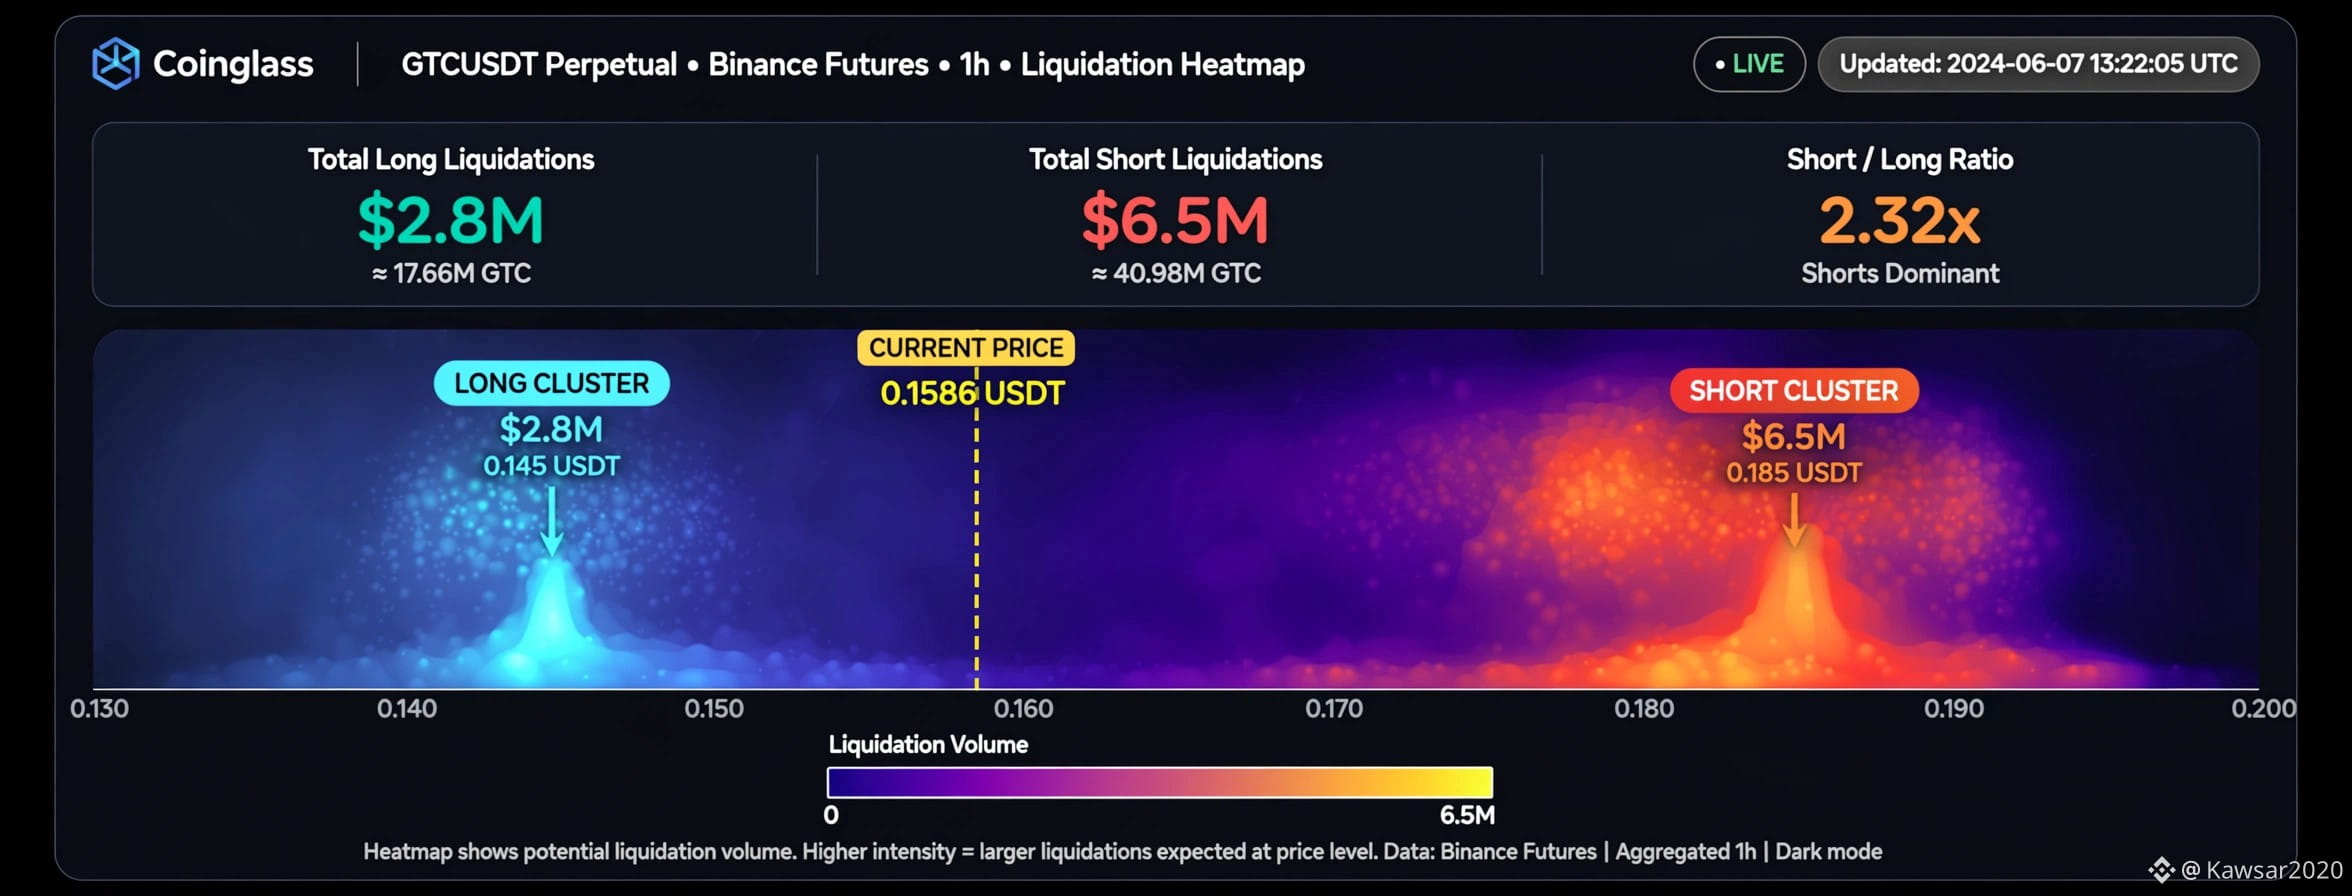
Peta Panas Likuidasi $GTCUSDT: 0.1586 USDT📊 Likuidasi
Total Likuidasi Long: $2.8M (∼17.66M GTC) di $0.145
Total Likuidasi Short: $6.5M (∼40.98M GTC) di $0.185
Rasio Short/Long: 2.32x - Short mendominasi🔥 Analisis:
Klaster short senilai $6.5M yang besar berada di $0.185. Dengan harga saat ini di $0.1586, harga kemungkinan akan terdorong naik untuk melikuidasi posisi short. Level Kunci:
Likuiditas support: $0.145 ($2.8M)
Likuiditas resistance: $0.185 ($6.5M)Bias: Diperkirakan terjadi short squeeze bullish. #BİNANCEFUTURES #LiquidationMap #CryptoTrading #BinanceSquareTalks #bnb $SAGA
$BTC $GTC
{spot}(GTCUSDT)
{spot}(BTCUSDT)
Peta Panas Likuidasi $GTCUSDT: 0.1586 USDT📊 Likuidasi
Total Likuidasi Long: $2.8M (∼17.66M GTC) di $0.145
Total Likuidasi Short: $6.5M (∼40.98M GTC) di $0.185
Rasio Short/Long: 2.32x - Short mendominasi🔥 Analisis:
Klaster short senilai $6.5M yang besar berada di $0.185. Dengan harga saat ini di $0.1586, harga kemungkinan akan terdorong naik untuk melikuidasi posisi short. Level Kunci:
Likuiditas support: $0.145 ($2.8M)
Likuiditas resistance: $0.185 ($6.5M)Bias: Diperkirakan terjadi short squeeze bullish. #BİNANCEFUTURES #LiquidationMap #CryptoTrading #BinanceSquareTalks #bnb $SAGA
$BTC $GTC
Total Likuidasi Long: $2.8M (∼17.66M GTC) di $0.145
Total Likuidasi Short: $6.5M (∼40.98M GTC) di $0.185
Rasio Short/Long: 2.32x - Short mendominasi🔥 Analisis:
Klaster short senilai $6.5M yang besar berada di $0.185. Dengan harga saat ini di $0.1586, harga kemungkinan akan terdorong naik untuk melikuidasi posisi short. Level Kunci:
Likuiditas support: $0.145 ($2.8M)
Likuiditas resistance: $0.185 ($6.5M)Bias: Diperkirakan terjadi short squeeze bullish. #BİNANCEFUTURES #LiquidationMap #CryptoTrading #BinanceSquareTalks #bnb $SAGA
$BTC $GTC
1
101

·
--
Bullish
Lihat terjemahan
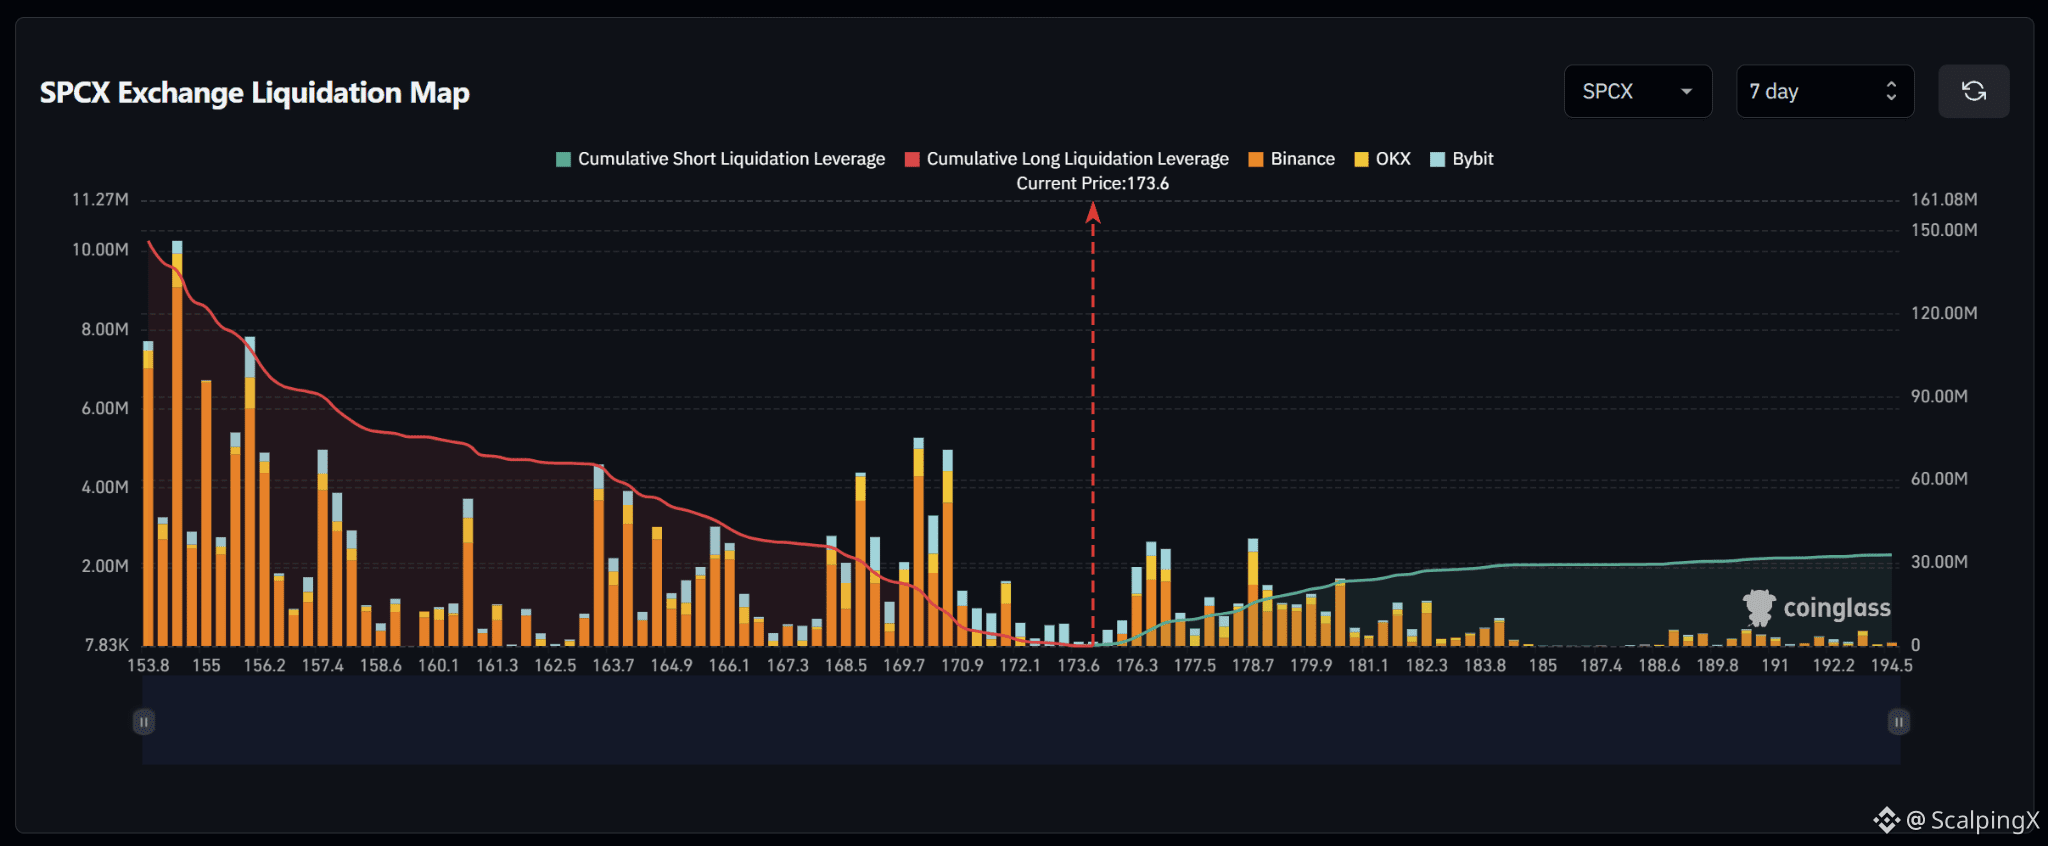
$SPCX – Liquidation Map (7 Days) – Current Price 173.6
🔎 The 7-day liquidation map shows roughly 145–150 million USD in long liquidations below the current price, nearly five times the approximately 30–31 million USD in short liquidations above. The liquidity structure therefore carries a very strong downside tilt.
📉 Below the market, long-liquidation liquidity is distributed heavily across 153.8–170.9. The strongest cluster sits around 153.8–156.2 with several bars near 5–10 million USD, while 168.5–170.3 also contains notable bars around 4–5.2 million USD. Closer to the current price, 169.7–170.9 is the most relevant liquidity pocket.
📈 Above the market, short-liquidation liquidity is significantly thinner. The nearest clusters sit around 176.3–179.9 with several bars near 1–2.6 million USD, while 180.5–183.8 continues to hold smaller liquidity layers. Liquidity thins sharply above 185.
🧭 The broader setup strongly favors the downside because long-liquidation exposure below dominates. Losing 170.9–169.7 would increase the probability of a sweep toward 168.5–166.1, followed by 163.7–160.1. Breaking above 176.3–178.7 would instead expose 179.9–183.8 before liquidity becomes much thinner.
#LiquidationMap
$SPCX – Liquidation Map (7 Days) – Current Price 173.6
🔎 The 7-day liquidation map shows roughly 145–150 million USD in long liquidations below the current price, nearly five times the approximately 30–31 million USD in short liquidations above. The liquidity structure therefore carries a very strong downside tilt.
📉 Below the market, long-liquidation liquidity is distributed heavily across 153.8–170.9. The strongest cluster sits around 153.8–156.2 with several bars near 5–10 million USD, while 168.5–170.3 also contains notable bars around 4–5.2 million USD. Closer to the current price, 169.7–170.9 is the most relevant liquidity pocket.
📈 Above the market, short-liquidation liquidity is significantly thinner. The nearest clusters sit around 176.3–179.9 with several bars near 1–2.6 million USD, while 180.5–183.8 continues to hold smaller liquidity layers. Liquidity thins sharply above 185.
🧭 The broader setup strongly favors the downside because long-liquidation exposure below dominates. Losing 170.9–169.7 would increase the probability of a sweep toward 168.5–166.1, followed by 163.7–160.1. Breaking above 176.3–178.7 would instead expose 179.9–183.8 before liquidity becomes much thinner.
#LiquidationMap
🔎 The 7-day liquidation map shows roughly 145–150 million USD in long liquidations below the current price, nearly five times the approximately 30–31 million USD in short liquidations above. The liquidity structure therefore carries a very strong downside tilt.
📉 Below the market, long-liquidation liquidity is distributed heavily across 153.8–170.9. The strongest cluster sits around 153.8–156.2 with several bars near 5–10 million USD, while 168.5–170.3 also contains notable bars around 4–5.2 million USD. Closer to the current price, 169.7–170.9 is the most relevant liquidity pocket.
📈 Above the market, short-liquidation liquidity is significantly thinner. The nearest clusters sit around 176.3–179.9 with several bars near 1–2.6 million USD, while 180.5–183.8 continues to hold smaller liquidity layers. Liquidity thins sharply above 185.
🧭 The broader setup strongly favors the downside because long-liquidation exposure below dominates. Losing 170.9–169.7 would increase the probability of a sweep toward 168.5–166.1, followed by 163.7–160.1. Breaking above 176.3–178.7 would instead expose 179.9–183.8 before liquidity becomes much thinner.
#LiquidationMap
6

·
--
Liquidation maps 101 📊
Bars ABOVE price = shorts. Push price up and they get squeezed — forced buybacks accelerate the move.
Bars BELOW price = longs. Drop price down and they get cascaded — forced selling accelerates the drop.
Price is a magnet for the brightest zones. Whales hunt where liquidations cluster.
Right now on the BTC heatmap (PerpDEX Wars data):
- Mapped liquidity: 905.6M — 66% sits BELOW as longs (598.7M), only 34% above as shorts
- Biggest cluster: 331.6M of longs at ~82,598 (-4.5%)
- Nearest shorts: 86,922 (+0.5%), then a 241.1M wall at 87,355–88,220
The last 24h already proved it: 22.16M in shorts got liquidated, up 1304% — that squeeze is what pushed BTC through 86K.
Read: the long side is crowded and exposed below, shorts are thin above 87K. The map doesn't say WHEN price moves — only WHERE the fuel sits. Size your leverage accordingly.
$BTC $ETH
#LiquidationMap #Bitcoin
---
Peta likuidasi 101 📊
Bar DI ATAS harga = short. Harga naik, mereka kena squeeze — buyback paksa mempercepat kenaikan.
Bar DI BAWAH harga = long. Harga turun, mereka kena cascade — jual paksa mempercepat penurunan.
Harga itu magnet buat zona paling terang. Whale berburu di tempat likuidasi menumpuk.
Kondisi sekarang di heatmap BTC (data PerpDEX Wars):
- Likuiditas terpetakan: 905,6M — 66% DI BAWAH sebagai long (598,7M), cuma 34% di atas sebagai short
- Cluster terbesar: 331,6M long di ~82.598 (-4,5%)
- Short terdekat: 86.922 (+0,5%), lalu tembok 241,1M di 87.355–88.220
24 jam terakhir udah ngebuktiin: 22,16M short kena likuidasi, naik 1304% — squeeze inilah yang dorong BTC tembus 86K.
Artinya: sisi long rame dan rentan di bawah, short tipis di atas 87K. Peta ini nggak bilang KAPAN harga gerak — cuma bilang DI MANA bahan bakarnya. Atur leverage sesuai itu.
#PetaLikuidasi #Bitcoin
Liquidation maps 101 📊
Bars ABOVE price = shorts. Push price up and they get squeezed — forced buybacks accelerate the move.
Bars BELOW price = longs. Drop price down and they get cascaded — forced selling accelerates the drop.
Price is a magnet for the brightest zones. Whales hunt where liquidations cluster.
Right now on the BTC heatmap (PerpDEX Wars data):
- Mapped liquidity: 905.6M — 66% sits BELOW as longs (598.7M), only 34% above as shorts
- Biggest cluster: 331.6M of longs at ~82,598 (-4.5%)
- Nearest shorts: 86,922 (+0.5%), then a 241.1M wall at 87,355–88,220
The last 24h already proved it: 22.16M in shorts got liquidated, up 1304% — that squeeze is what pushed BTC through 86K.
Read: the long side is crowded and exposed below, shorts are thin above 87K. The map doesn't say WHEN price moves — only WHERE the fuel sits. Size your leverage accordingly.
$BTC $ETH
#LiquidationMap #Bitcoin
---
Peta likuidasi 101 📊
Bar DI ATAS harga = short. Harga naik, mereka kena squeeze — buyback paksa mempercepat kenaikan.
Bar DI BAWAH harga = long. Harga turun, mereka kena cascade — jual paksa mempercepat penurunan.
Harga itu magnet buat zona paling terang. Whale berburu di tempat likuidasi menumpuk.
Kondisi sekarang di heatmap BTC (data PerpDEX Wars):
- Likuiditas terpetakan: 905,6M — 66% DI BAWAH sebagai long (598,7M), cuma 34% di atas sebagai short
- Cluster terbesar: 331,6M long di ~82.598 (-4,5%)
- Short terdekat: 86.922 (+0,5%), lalu tembok 241,1M di 87.355–88.220
24 jam terakhir udah ngebuktiin: 22,16M short kena likuidasi, naik 1304% — squeeze inilah yang dorong BTC tembus 86K.
Artinya: sisi long rame dan rentan di bawah, short tipis di atas 87K. Peta ini nggak bilang KAPAN harga gerak — cuma bilang DI MANA bahan bakarnya. Atur leverage sesuai itu.
#PetaLikuidasi #Bitcoin
Bars ABOVE price = shorts. Push price up and they get squeezed — forced buybacks accelerate the move.
Bars BELOW price = longs. Drop price down and they get cascaded — forced selling accelerates the drop.
Price is a magnet for the brightest zones. Whales hunt where liquidations cluster.
Right now on the BTC heatmap (PerpDEX Wars data):
- Mapped liquidity: 905.6M — 66% sits BELOW as longs (598.7M), only 34% above as shorts
- Biggest cluster: 331.6M of longs at ~82,598 (-4.5%)
- Nearest shorts: 86,922 (+0.5%), then a 241.1M wall at 87,355–88,220
The last 24h already proved it: 22.16M in shorts got liquidated, up 1304% — that squeeze is what pushed BTC through 86K.
Read: the long side is crowded and exposed below, shorts are thin above 87K. The map doesn't say WHEN price moves — only WHERE the fuel sits. Size your leverage accordingly.
$BTC $ETH
#LiquidationMap #Bitcoin
---
Peta likuidasi 101 📊
Bar DI ATAS harga = short. Harga naik, mereka kena squeeze — buyback paksa mempercepat kenaikan.
Bar DI BAWAH harga = long. Harga turun, mereka kena cascade — jual paksa mempercepat penurunan.
Harga itu magnet buat zona paling terang. Whale berburu di tempat likuidasi menumpuk.
Kondisi sekarang di heatmap BTC (data PerpDEX Wars):
- Likuiditas terpetakan: 905,6M — 66% DI BAWAH sebagai long (598,7M), cuma 34% di atas sebagai short
- Cluster terbesar: 331,6M long di ~82.598 (-4,5%)
- Short terdekat: 86.922 (+0,5%), lalu tembok 241,1M di 87.355–88.220
24 jam terakhir udah ngebuktiin: 22,16M short kena likuidasi, naik 1304% — squeeze inilah yang dorong BTC tembus 86K.
Artinya: sisi long rame dan rentan di bawah, short tipis di atas 87K. Peta ini nggak bilang KAPAN harga gerak — cuma bilang DI MANA bahan bakarnya. Atur leverage sesuai itu.
#PetaLikuidasi #Bitcoin
65
·
--
Bullish
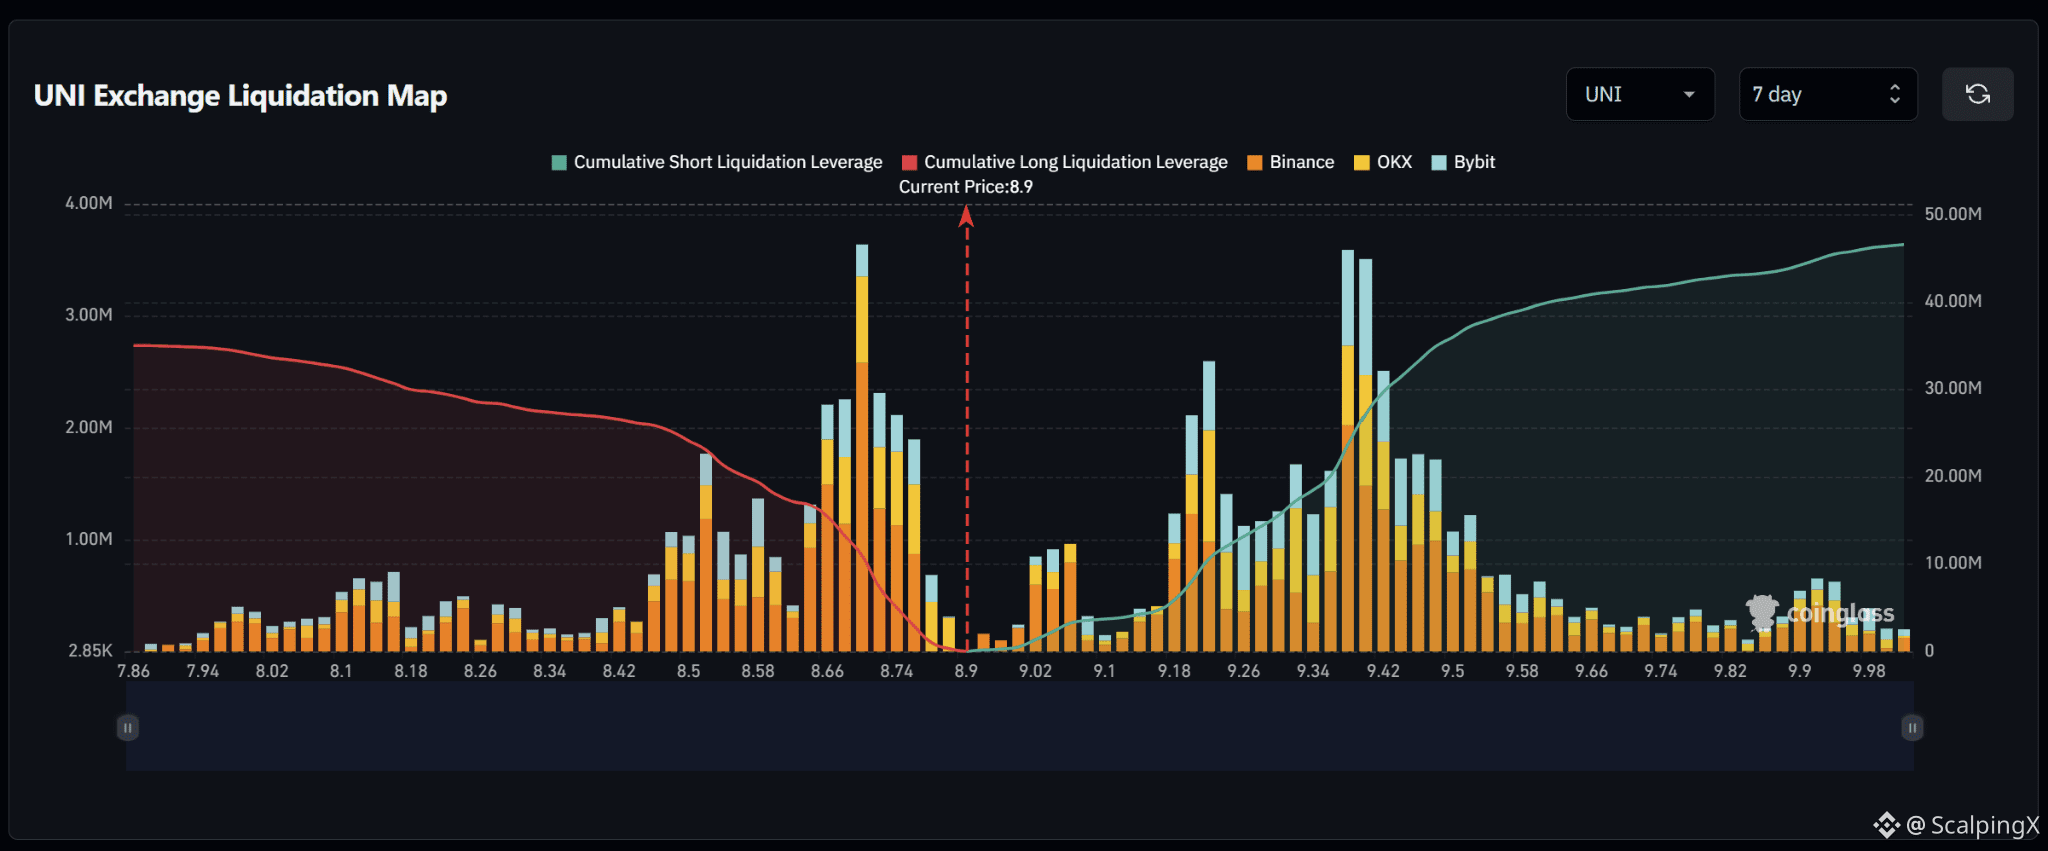
$UNI – Peta Likuidasi (7 Hari) – Harga Saat Ini 8.90
🔎 Peta likuidasi 7 hari menunjukkan sekitar 45–46 juta USD likuidasi posisi short di atas harga saat ini, lebih besar daripada sekitar 34–35 juta USD likuidasi posisi long di bawahnya. Karena itu, struktur likuiditas memiliki kecenderungan naik yang cukup jelas, dengan total likuiditas di atas pasar sekitar 1,3 kali lebih besar.
📉 Di bawah pasar, likuiditas likuidasi posisi long terkonsentrasi kuat di rentang 8.50–8.78. Klaster terkuat berada di sekitar 8.64–8.75, dengan beberapa batang bernilai sekitar 1.5–3.6 juta USD dan konsentrasi terpadat di sekitar 8.69–8.71. Jika level 8.82–8.74 ditembus ke bawah, perhatian akan beralih ke 8.66–8.58, lalu 8.50.
📈 Di atas pasar, likuiditas likuidasi posisi short terkonsentrasi di rentang 9.18–9.26 dan terutama 9.34–9.50. Klaster terkuat berada di sekitar 9.37–9.42, dengan batang bernilai sekitar 3.5–3.6 juta USD, sementara rentang 9.18–9.23 juga memiliki satu batang bernilai sekitar 2–2.6 juta USD. Lebih jauh di atas, rentang 9.44–9.52 masih menyimpan beberapa lapisan likuiditas yang cukup besar.
🧭 Gambaran yang lebih luas mendukung arah naik karena eksposur likuidasi posisi short di atas lebih besar. Jika harga menembus 9.10–9.18 ke atas, level 9.22–9.26 akan terekspos, disusul zona likuiditas utama 9.34–9.42 dan 9.44–9.52. Sebaliknya, jika level 8.82–8.74 ditembus ke bawah, peluang terjadinya sapuan menuju 8.66–8.58 lalu 8.50 akan meningkat.
#LiquidationMap
$UNI – Peta Likuidasi (7 Hari) – Harga Saat Ini 8.90
🔎 Peta likuidasi 7 hari menunjukkan sekitar 45–46 juta USD likuidasi posisi short di atas harga saat ini, lebih besar daripada sekitar 34–35 juta USD likuidasi posisi long di bawahnya. Karena itu, struktur likuiditas memiliki kecenderungan naik yang cukup jelas, dengan total likuiditas di atas pasar sekitar 1,3 kali lebih besar.
📉 Di bawah pasar, likuiditas likuidasi posisi long terkonsentrasi kuat di rentang 8.50–8.78. Klaster terkuat berada di sekitar 8.64–8.75, dengan beberapa batang bernilai sekitar 1.5–3.6 juta USD dan konsentrasi terpadat di sekitar 8.69–8.71. Jika level 8.82–8.74 ditembus ke bawah, perhatian akan beralih ke 8.66–8.58, lalu 8.50.
📈 Di atas pasar, likuiditas likuidasi posisi short terkonsentrasi di rentang 9.18–9.26 dan terutama 9.34–9.50. Klaster terkuat berada di sekitar 9.37–9.42, dengan batang bernilai sekitar 3.5–3.6 juta USD, sementara rentang 9.18–9.23 juga memiliki satu batang bernilai sekitar 2–2.6 juta USD. Lebih jauh di atas, rentang 9.44–9.52 masih menyimpan beberapa lapisan likuiditas yang cukup besar.
🧭 Gambaran yang lebih luas mendukung arah naik karena eksposur likuidasi posisi short di atas lebih besar. Jika harga menembus 9.10–9.18 ke atas, level 9.22–9.26 akan terekspos, disusul zona likuiditas utama 9.34–9.42 dan 9.44–9.52. Sebaliknya, jika level 8.82–8.74 ditembus ke bawah, peluang terjadinya sapuan menuju 8.66–8.58 lalu 8.50 akan meningkat.
#LiquidationMap
🔎 Peta likuidasi 7 hari menunjukkan sekitar 45–46 juta USD likuidasi posisi short di atas harga saat ini, lebih besar daripada sekitar 34–35 juta USD likuidasi posisi long di bawahnya. Karena itu, struktur likuiditas memiliki kecenderungan naik yang cukup jelas, dengan total likuiditas di atas pasar sekitar 1,3 kali lebih besar.
📉 Di bawah pasar, likuiditas likuidasi posisi long terkonsentrasi kuat di rentang 8.50–8.78. Klaster terkuat berada di sekitar 8.64–8.75, dengan beberapa batang bernilai sekitar 1.5–3.6 juta USD dan konsentrasi terpadat di sekitar 8.69–8.71. Jika level 8.82–8.74 ditembus ke bawah, perhatian akan beralih ke 8.66–8.58, lalu 8.50.
📈 Di atas pasar, likuiditas likuidasi posisi short terkonsentrasi di rentang 9.18–9.26 dan terutama 9.34–9.50. Klaster terkuat berada di sekitar 9.37–9.42, dengan batang bernilai sekitar 3.5–3.6 juta USD, sementara rentang 9.18–9.23 juga memiliki satu batang bernilai sekitar 2–2.6 juta USD. Lebih jauh di atas, rentang 9.44–9.52 masih menyimpan beberapa lapisan likuiditas yang cukup besar.
🧭 Gambaran yang lebih luas mendukung arah naik karena eksposur likuidasi posisi short di atas lebih besar. Jika harga menembus 9.10–9.18 ke atas, level 9.22–9.26 akan terekspos, disusul zona likuiditas utama 9.34–9.42 dan 9.44–9.52. Sebaliknya, jika level 8.82–8.74 ditembus ke bawah, peluang terjadinya sapuan menuju 8.66–8.58 lalu 8.50 akan meningkat.
#LiquidationMap
19
·
--
Bullish
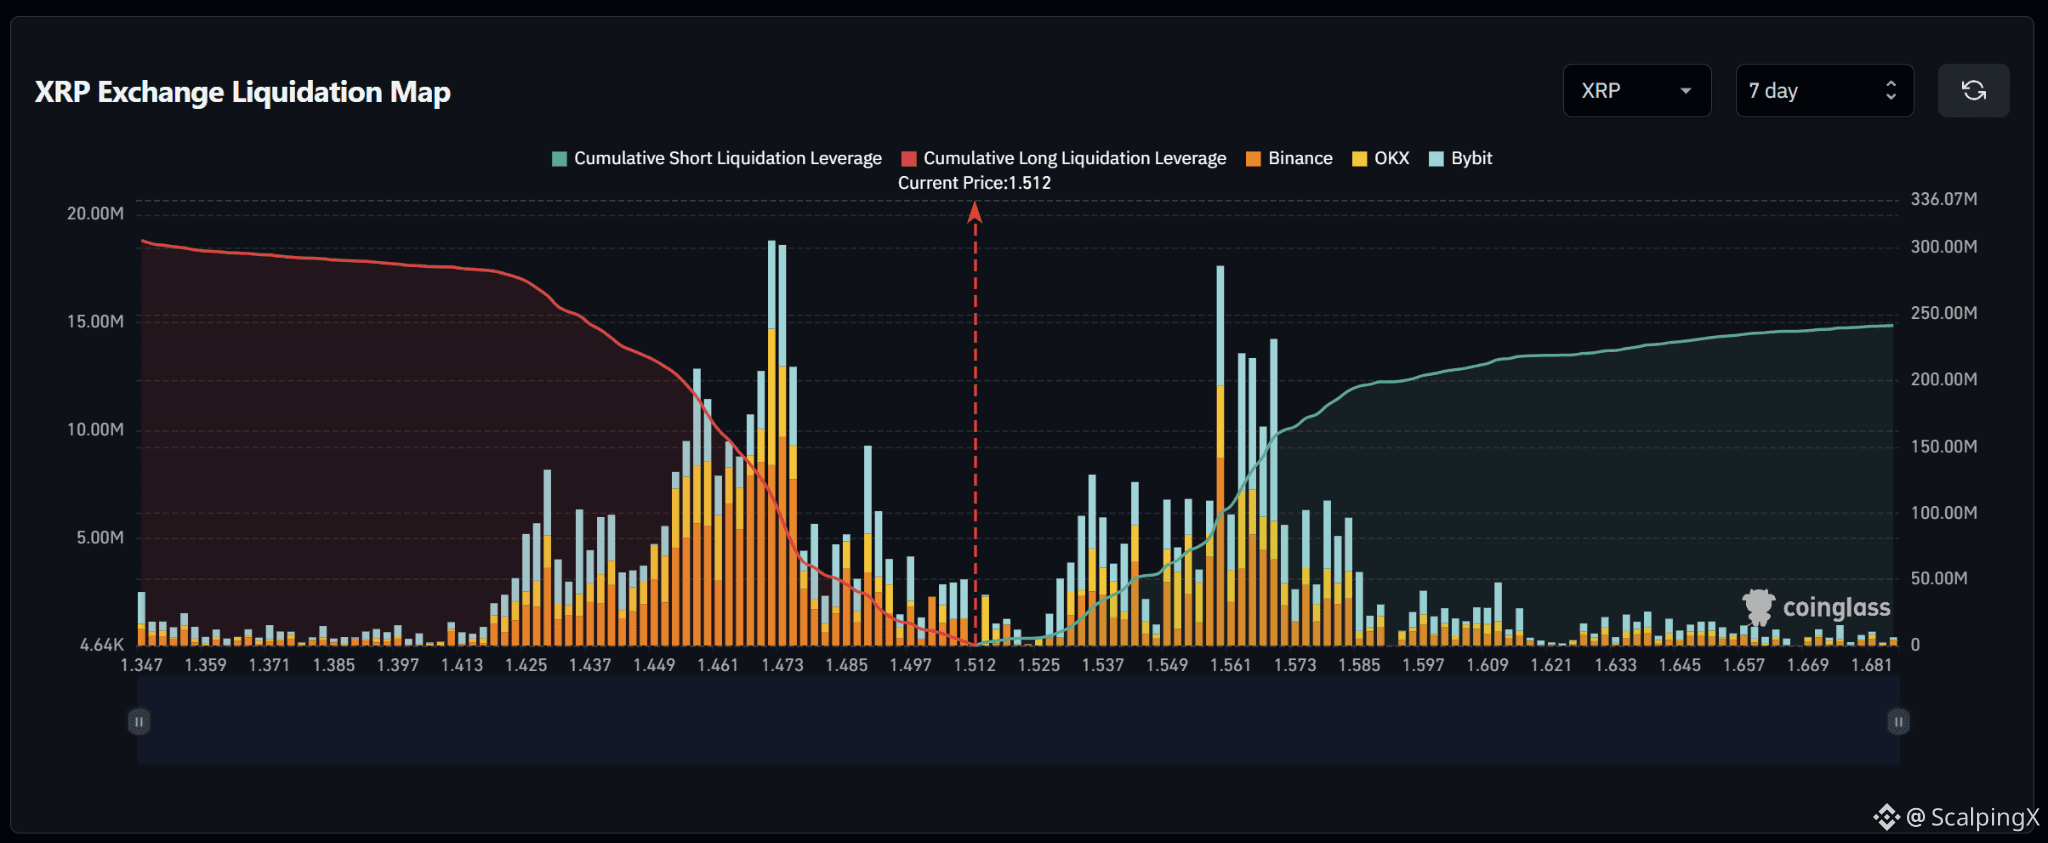
$XRP – Peta Likuidasi (7 Hari) – Harga Saat Ini 1.512
🔎 Peta likuidasi 7 hari menunjukkan sekitar 300–305 juta USD likuidasi posisi long di bawah harga saat ini, lebih besar daripada sekitar 240–245 juta USD likuidasi posisi short di atasnya. Dengan demikian, struktur likuiditas memiliki kecenderungan turun yang cukup jelas, dengan total likuiditas di bawah pasar sekitar 1,25 kali lebih besar.
📉 Di bawah pasar, likuiditas likuidasi posisi long terkonsentrasi kuat di rentang 1.449–1.476. Klaster terkuat berada di sekitar 1.468–1.474, dengan beberapa batang bernilai sekitar 13–19 juta USD, sementara rentang 1.450–1.463 juga memiliki beberapa kantong likuiditas sekitar 8–13 juta USD. Jika level 1.497–1.485 ditembus ke bawah, perhatian akan beralih ke 1.476–1.468, lalu 1.461–1.449.
📈 Di atas pasar, likuiditas likuidasi posisi short terkonsentrasi di rentang 1.535–1.585. Klaster terkuat berada di sekitar 1.556–1.573, dengan beberapa batang bernilai sekitar 10–18 juta USD; area 1.559–1.562 paling menonjol. Lebih jauh di atas, rentang 1.575–1.585 masih memiliki beberapa batang sekitar 5–7 juta USD.
🧭 Gambaran yang lebih luas lebih mendukung pergerakan turun karena eksposur likuidasi posisi long di bawah pasar lebih besar. Jika level 1.497–1.485 ditembus ke bawah, kemungkinan terjadinya sapuan menuju 1.476–1.468 akan meningkat, diikuti 1.461–1.449. Sebaliknya, jika harga menembus ke atas 1.535–1.549, area 1.556–1.573 akan terbuka, lalu 1.580–1.585.
#LiquidationMap
$XRP – Peta Likuidasi (7 Hari) – Harga Saat Ini 1.512
🔎 Peta likuidasi 7 hari menunjukkan sekitar 300–305 juta USD likuidasi posisi long di bawah harga saat ini, lebih besar daripada sekitar 240–245 juta USD likuidasi posisi short di atasnya. Dengan demikian, struktur likuiditas memiliki kecenderungan turun yang cukup jelas, dengan total likuiditas di bawah pasar sekitar 1,25 kali lebih besar.
📉 Di bawah pasar, likuiditas likuidasi posisi long terkonsentrasi kuat di rentang 1.449–1.476. Klaster terkuat berada di sekitar 1.468–1.474, dengan beberapa batang bernilai sekitar 13–19 juta USD, sementara rentang 1.450–1.463 juga memiliki beberapa kantong likuiditas sekitar 8–13 juta USD. Jika level 1.497–1.485 ditembus ke bawah, perhatian akan beralih ke 1.476–1.468, lalu 1.461–1.449.
📈 Di atas pasar, likuiditas likuidasi posisi short terkonsentrasi di rentang 1.535–1.585. Klaster terkuat berada di sekitar 1.556–1.573, dengan beberapa batang bernilai sekitar 10–18 juta USD; area 1.559–1.562 paling menonjol. Lebih jauh di atas, rentang 1.575–1.585 masih memiliki beberapa batang sekitar 5–7 juta USD.
🧭 Gambaran yang lebih luas lebih mendukung pergerakan turun karena eksposur likuidasi posisi long di bawah pasar lebih besar. Jika level 1.497–1.485 ditembus ke bawah, kemungkinan terjadinya sapuan menuju 1.476–1.468 akan meningkat, diikuti 1.461–1.449. Sebaliknya, jika harga menembus ke atas 1.535–1.549, area 1.556–1.573 akan terbuka, lalu 1.580–1.585.
#LiquidationMap
🔎 Peta likuidasi 7 hari menunjukkan sekitar 300–305 juta USD likuidasi posisi long di bawah harga saat ini, lebih besar daripada sekitar 240–245 juta USD likuidasi posisi short di atasnya. Dengan demikian, struktur likuiditas memiliki kecenderungan turun yang cukup jelas, dengan total likuiditas di bawah pasar sekitar 1,25 kali lebih besar.
📉 Di bawah pasar, likuiditas likuidasi posisi long terkonsentrasi kuat di rentang 1.449–1.476. Klaster terkuat berada di sekitar 1.468–1.474, dengan beberapa batang bernilai sekitar 13–19 juta USD, sementara rentang 1.450–1.463 juga memiliki beberapa kantong likuiditas sekitar 8–13 juta USD. Jika level 1.497–1.485 ditembus ke bawah, perhatian akan beralih ke 1.476–1.468, lalu 1.461–1.449.
📈 Di atas pasar, likuiditas likuidasi posisi short terkonsentrasi di rentang 1.535–1.585. Klaster terkuat berada di sekitar 1.556–1.573, dengan beberapa batang bernilai sekitar 10–18 juta USD; area 1.559–1.562 paling menonjol. Lebih jauh di atas, rentang 1.575–1.585 masih memiliki beberapa batang sekitar 5–7 juta USD.
🧭 Gambaran yang lebih luas lebih mendukung pergerakan turun karena eksposur likuidasi posisi long di bawah pasar lebih besar. Jika level 1.497–1.485 ditembus ke bawah, kemungkinan terjadinya sapuan menuju 1.476–1.468 akan meningkat, diikuti 1.461–1.449. Sebaliknya, jika harga menembus ke atas 1.535–1.549, area 1.556–1.573 akan terbuka, lalu 1.580–1.585.
#LiquidationMap
23
·
--
Bullish
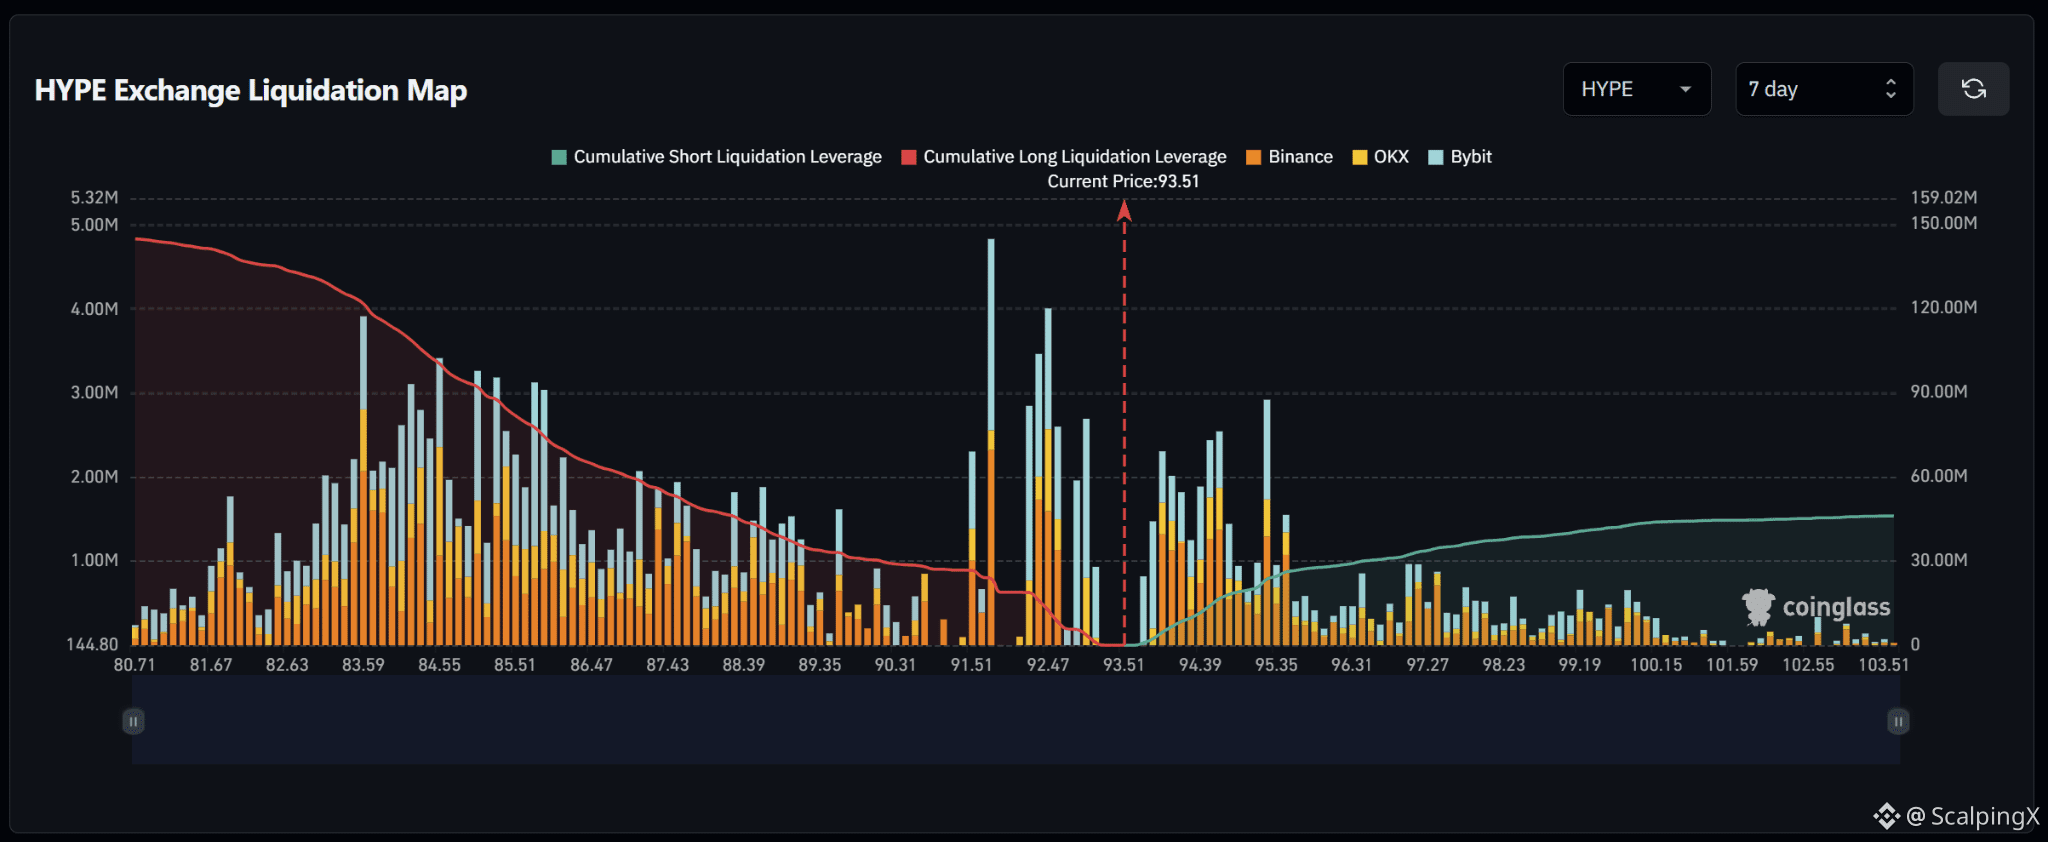
$HYPE – Peta Likuidasi (7 Hari) – Harga Saat Ini 93.51
🔎 Peta likuidasi 7 hari menunjukkan sekitar 145 juta USD likuidasi posisi long di bawah harga saat ini, hampir empat kali lipat dari sekitar 35–38 juta USD likuidasi posisi short di atasnya. Karena itu, struktur likuiditas menunjukkan kecenderungan penurunan yang sangat kuat.
📉 Di bawah pasar, likuiditas likuidasi posisi long terkonsentrasi terutama di rentang 91.5–92.8. Klaster terkuat berada di sekitar 91.7–92.0 dengan batang sekitar 4.8 juta USD, sementara rentang 92.3–92.6 memiliki batang tambahan sekitar 3–4 juta USD. Lebih jauh di bawah, rentang 83.5–85.8 masih menyimpan pita likuiditas besar lainnya.
📈 Di atas pasar, likuiditas likuidasi posisi short terdekat terkonsentrasi di rentang 94.0–95.6. Klaster penting terlihat di sekitar 94.0–94.6 dengan batang sekitar 2–2.5 juta USD dan 95.2–95.5 dengan batang mendekati 2.9 juta USD. Likuiditas menipis secara nyata di atas 96.0.
🧭 Gambaran yang lebih luas sangat mendukung penurunan karena eksposur likuidasi posisi long di bawah harga mendominasi. Jika level 92.5–91.5 ditembus ke bawah, kemungkinan terjadinya sapuan lebih dalam menuju 90.3–89.3 akan meningkat, disusul 87.5–85.5. Sebaliknya, jika harga menembus 94.0–94.6 ke atas, level 95.2–95.6 akan terbuka sebelum likuiditas menipis.
#LiquidationMap
$HYPE – Peta Likuidasi (7 Hari) – Harga Saat Ini 93.51
🔎 Peta likuidasi 7 hari menunjukkan sekitar 145 juta USD likuidasi posisi long di bawah harga saat ini, hampir empat kali lipat dari sekitar 35–38 juta USD likuidasi posisi short di atasnya. Karena itu, struktur likuiditas menunjukkan kecenderungan penurunan yang sangat kuat.
📉 Di bawah pasar, likuiditas likuidasi posisi long terkonsentrasi terutama di rentang 91.5–92.8. Klaster terkuat berada di sekitar 91.7–92.0 dengan batang sekitar 4.8 juta USD, sementara rentang 92.3–92.6 memiliki batang tambahan sekitar 3–4 juta USD. Lebih jauh di bawah, rentang 83.5–85.8 masih menyimpan pita likuiditas besar lainnya.
📈 Di atas pasar, likuiditas likuidasi posisi short terdekat terkonsentrasi di rentang 94.0–95.6. Klaster penting terlihat di sekitar 94.0–94.6 dengan batang sekitar 2–2.5 juta USD dan 95.2–95.5 dengan batang mendekati 2.9 juta USD. Likuiditas menipis secara nyata di atas 96.0.
🧭 Gambaran yang lebih luas sangat mendukung penurunan karena eksposur likuidasi posisi long di bawah harga mendominasi. Jika level 92.5–91.5 ditembus ke bawah, kemungkinan terjadinya sapuan lebih dalam menuju 90.3–89.3 akan meningkat, disusul 87.5–85.5. Sebaliknya, jika harga menembus 94.0–94.6 ke atas, level 95.2–95.6 akan terbuka sebelum likuiditas menipis.
#LiquidationMap
🔎 Peta likuidasi 7 hari menunjukkan sekitar 145 juta USD likuidasi posisi long di bawah harga saat ini, hampir empat kali lipat dari sekitar 35–38 juta USD likuidasi posisi short di atasnya. Karena itu, struktur likuiditas menunjukkan kecenderungan penurunan yang sangat kuat.
📉 Di bawah pasar, likuiditas likuidasi posisi long terkonsentrasi terutama di rentang 91.5–92.8. Klaster terkuat berada di sekitar 91.7–92.0 dengan batang sekitar 4.8 juta USD, sementara rentang 92.3–92.6 memiliki batang tambahan sekitar 3–4 juta USD. Lebih jauh di bawah, rentang 83.5–85.8 masih menyimpan pita likuiditas besar lainnya.
📈 Di atas pasar, likuiditas likuidasi posisi short terdekat terkonsentrasi di rentang 94.0–95.6. Klaster penting terlihat di sekitar 94.0–94.6 dengan batang sekitar 2–2.5 juta USD dan 95.2–95.5 dengan batang mendekati 2.9 juta USD. Likuiditas menipis secara nyata di atas 96.0.
🧭 Gambaran yang lebih luas sangat mendukung penurunan karena eksposur likuidasi posisi long di bawah harga mendominasi. Jika level 92.5–91.5 ditembus ke bawah, kemungkinan terjadinya sapuan lebih dalam menuju 90.3–89.3 akan meningkat, disusul 87.5–85.5. Sebaliknya, jika harga menembus 94.0–94.6 ke atas, level 95.2–95.6 akan terbuka sebelum likuiditas menipis.
#LiquidationMap
26
·
--
Bullish
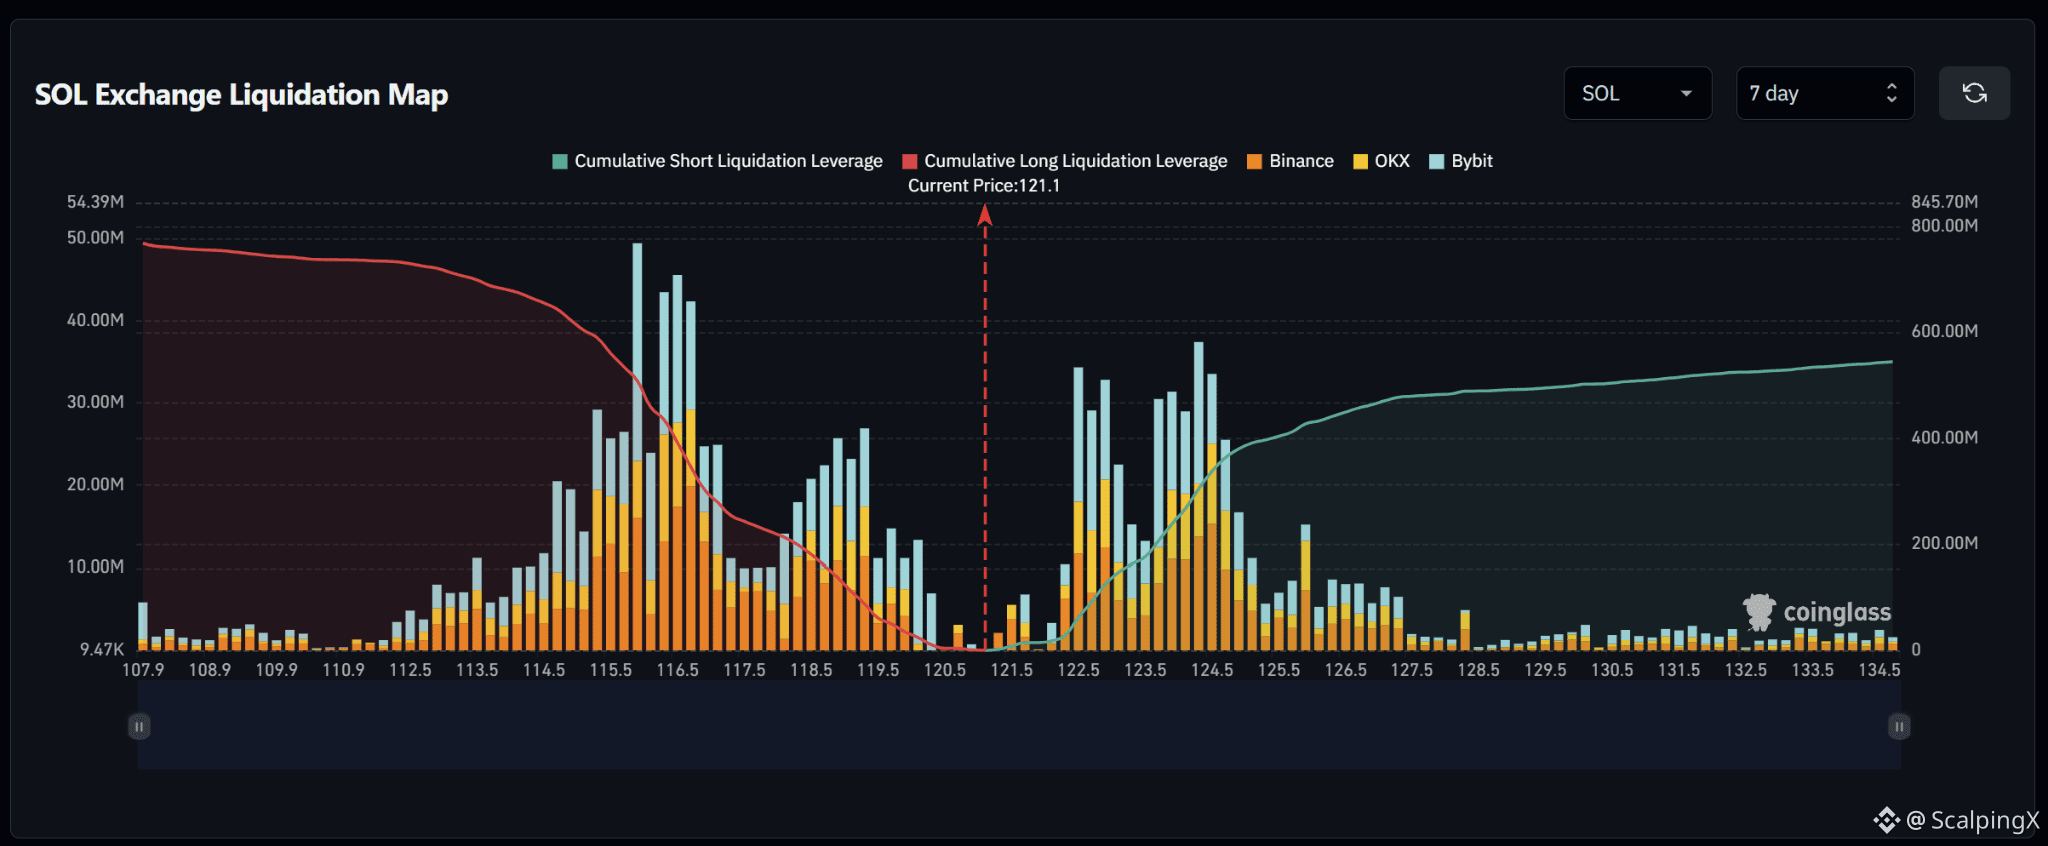
$SOL – Peta Likuidasi (7 Hari) – Harga Saat Ini 121.1
🔎 Peta likuidasi 7 hari menunjukkan sekitar 760–780 juta USD likuidasi posisi long di bawah harga saat ini, lebih besar daripada sekitar 540–560 juta USD likuidasi posisi short di atasnya. Karena itu, struktur likuiditas menunjukkan kecenderungan turun yang cukup jelas.
📉 Di bawah pasar, likuiditas likuidasi posisi long paling terkonsentrasi pada rentang 115.3–116.8. Klaster terkuat berada di sekitar 115.8–116.6 dengan beberapa batang di kisaran 25–49 juta USD, sementara rentang 118.2–119.2 juga memiliki klaster penting lainnya dengan beberapa batang di kisaran 18–27 juta USD. Jika level 120.5–119.5 ditembus ke bawah, perhatian akan beralih ke 118.8–118.0, lalu 116.8–115.5.
📈 Di atas pasar, likuiditas likuidasi posisi short terkonsentrasi pada rentang 122.3–124.8. Klaster terkuat berada di sekitar 123.5–124.5 dengan beberapa batang di kisaran 25–38 juta USD, sementara rentang 122.3–123.0 juga mencakup batang di kisaran 25–35 juta USD. Lebih jauh di atas, rentang 125.5–127.0 masih memiliki lapisan likuiditas yang lebih kecil.
🧭 Gambaran yang lebih luas cenderung mengarah ke penurunan karena eksposur likuidasi posisi long di bawah lebih besar. Jika level 120.5–119.5 ditembus ke bawah, probabilitas pergerakan menuju 118.8–118.0 akan meningkat, disusul 116.8–115.5. Sebaliknya, jika harga menembus 122.3–123.0 ke atas, level 123.5–124.5, lalu 125.5–127.0, akan menjadi sasaran berikutnya.
#LiquidationMap
$SOL – Peta Likuidasi (7 Hari) – Harga Saat Ini 121.1
🔎 Peta likuidasi 7 hari menunjukkan sekitar 760–780 juta USD likuidasi posisi long di bawah harga saat ini, lebih besar daripada sekitar 540–560 juta USD likuidasi posisi short di atasnya. Karena itu, struktur likuiditas menunjukkan kecenderungan turun yang cukup jelas.
📉 Di bawah pasar, likuiditas likuidasi posisi long paling terkonsentrasi pada rentang 115.3–116.8. Klaster terkuat berada di sekitar 115.8–116.6 dengan beberapa batang di kisaran 25–49 juta USD, sementara rentang 118.2–119.2 juga memiliki klaster penting lainnya dengan beberapa batang di kisaran 18–27 juta USD. Jika level 120.5–119.5 ditembus ke bawah, perhatian akan beralih ke 118.8–118.0, lalu 116.8–115.5.
📈 Di atas pasar, likuiditas likuidasi posisi short terkonsentrasi pada rentang 122.3–124.8. Klaster terkuat berada di sekitar 123.5–124.5 dengan beberapa batang di kisaran 25–38 juta USD, sementara rentang 122.3–123.0 juga mencakup batang di kisaran 25–35 juta USD. Lebih jauh di atas, rentang 125.5–127.0 masih memiliki lapisan likuiditas yang lebih kecil.
🧭 Gambaran yang lebih luas cenderung mengarah ke penurunan karena eksposur likuidasi posisi long di bawah lebih besar. Jika level 120.5–119.5 ditembus ke bawah, probabilitas pergerakan menuju 118.8–118.0 akan meningkat, disusul 116.8–115.5. Sebaliknya, jika harga menembus 122.3–123.0 ke atas, level 123.5–124.5, lalu 125.5–127.0, akan menjadi sasaran berikutnya.
#LiquidationMap
🔎 Peta likuidasi 7 hari menunjukkan sekitar 760–780 juta USD likuidasi posisi long di bawah harga saat ini, lebih besar daripada sekitar 540–560 juta USD likuidasi posisi short di atasnya. Karena itu, struktur likuiditas menunjukkan kecenderungan turun yang cukup jelas.
📉 Di bawah pasar, likuiditas likuidasi posisi long paling terkonsentrasi pada rentang 115.3–116.8. Klaster terkuat berada di sekitar 115.8–116.6 dengan beberapa batang di kisaran 25–49 juta USD, sementara rentang 118.2–119.2 juga memiliki klaster penting lainnya dengan beberapa batang di kisaran 18–27 juta USD. Jika level 120.5–119.5 ditembus ke bawah, perhatian akan beralih ke 118.8–118.0, lalu 116.8–115.5.
📈 Di atas pasar, likuiditas likuidasi posisi short terkonsentrasi pada rentang 122.3–124.8. Klaster terkuat berada di sekitar 123.5–124.5 dengan beberapa batang di kisaran 25–38 juta USD, sementara rentang 122.3–123.0 juga mencakup batang di kisaran 25–35 juta USD. Lebih jauh di atas, rentang 125.5–127.0 masih memiliki lapisan likuiditas yang lebih kecil.
🧭 Gambaran yang lebih luas cenderung mengarah ke penurunan karena eksposur likuidasi posisi long di bawah lebih besar. Jika level 120.5–119.5 ditembus ke bawah, probabilitas pergerakan menuju 118.8–118.0 akan meningkat, disusul 116.8–115.5. Sebaliknya, jika harga menembus 122.3–123.0 ke atas, level 123.5–124.5, lalu 125.5–127.0, akan menjadi sasaran berikutnya.
#LiquidationMap
43
·
--
Bullish
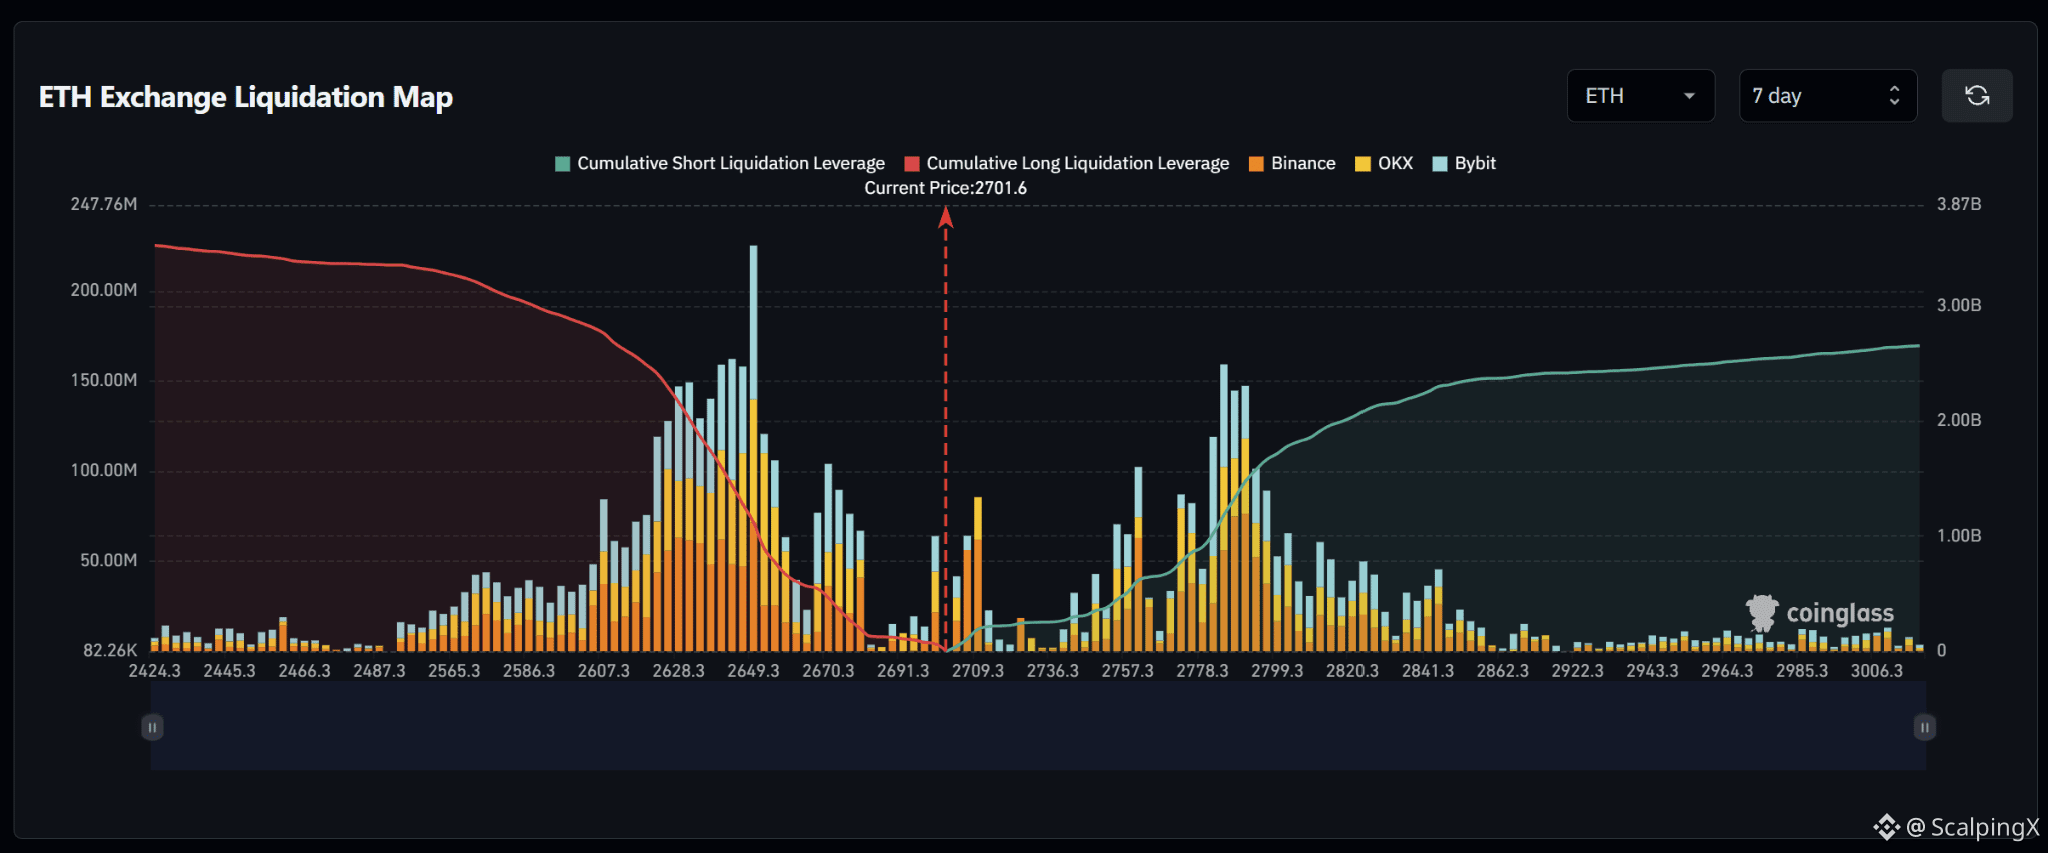
$ETH – Peta Likuidasi (7 Hari) – Harga Saat Ini 2,701.6
🔎 Peta likuidasi 7 hari menunjukkan sekitar 3.4–3.5 miliar USD likuidasi posisi long di bawah harga saat ini, lebih besar daripada sekitar 2.6–2.7 miliar USD likuidasi posisi short di atasnya. Karena itu, struktur likuiditas menunjukkan kecenderungan turun yang cukup jelas.
📉 Di bawah pasar, likuiditas likuidasi posisi long terkonsentrasi kuat di rentang 2,610–2,675. Klaster terkuat berada di sekitar 2,635–2,655, dengan beberapa batang di kisaran 140–225 juta USD dan konsentrasi terpadat di sekitar 2,649. Area 2,660–2,675 juga mencakup beberapa batang di kisaran 70–105 juta USD. Jika level 2,690–2,680 ditembus ke bawah, perhatian akan beralih ke 2,670–2,645, lalu 2,630–2,610.
📈 Di atas pasar, likuiditas likuidasi posisi short terkonsentrasi di rentang 2,750–2,805. Klaster terkuat berada di sekitar 2,780–2,795, dengan beberapa batang di kisaran 120–160 juta USD, sementara area 2,755–2,770 juga memiliki kantong likuiditas sekitar 70–100 juta USD. Lebih jauh di atas, rentang 2,810–2,850 masih menampung pita likuiditas penting lainnya.
🧭 Gambaran yang lebih luas lebih mendukung skenario turun karena eksposur likuidasi posisi long di bawah harga lebih besar. Jika level 2,690–2,680 ditembus ke bawah, kemungkinan terjadinya sapuan menuju 2,670–2,645 akan meningkat, disusul 2,630–2,610. Sebaliknya, jika harga menembus 2,735–2,755 ke atas, level 2,780–2,795 akan terekspos, lalu 2,810–2,850.
#LiquidationMap
$ETH – Peta Likuidasi (7 Hari) – Harga Saat Ini 2,701.6
🔎 Peta likuidasi 7 hari menunjukkan sekitar 3.4–3.5 miliar USD likuidasi posisi long di bawah harga saat ini, lebih besar daripada sekitar 2.6–2.7 miliar USD likuidasi posisi short di atasnya. Karena itu, struktur likuiditas menunjukkan kecenderungan turun yang cukup jelas.
📉 Di bawah pasar, likuiditas likuidasi posisi long terkonsentrasi kuat di rentang 2,610–2,675. Klaster terkuat berada di sekitar 2,635–2,655, dengan beberapa batang di kisaran 140–225 juta USD dan konsentrasi terpadat di sekitar 2,649. Area 2,660–2,675 juga mencakup beberapa batang di kisaran 70–105 juta USD. Jika level 2,690–2,680 ditembus ke bawah, perhatian akan beralih ke 2,670–2,645, lalu 2,630–2,610.
📈 Di atas pasar, likuiditas likuidasi posisi short terkonsentrasi di rentang 2,750–2,805. Klaster terkuat berada di sekitar 2,780–2,795, dengan beberapa batang di kisaran 120–160 juta USD, sementara area 2,755–2,770 juga memiliki kantong likuiditas sekitar 70–100 juta USD. Lebih jauh di atas, rentang 2,810–2,850 masih menampung pita likuiditas penting lainnya.
🧭 Gambaran yang lebih luas lebih mendukung skenario turun karena eksposur likuidasi posisi long di bawah harga lebih besar. Jika level 2,690–2,680 ditembus ke bawah, kemungkinan terjadinya sapuan menuju 2,670–2,645 akan meningkat, disusul 2,630–2,610. Sebaliknya, jika harga menembus 2,735–2,755 ke atas, level 2,780–2,795 akan terekspos, lalu 2,810–2,850.
#LiquidationMap
🔎 Peta likuidasi 7 hari menunjukkan sekitar 3.4–3.5 miliar USD likuidasi posisi long di bawah harga saat ini, lebih besar daripada sekitar 2.6–2.7 miliar USD likuidasi posisi short di atasnya. Karena itu, struktur likuiditas menunjukkan kecenderungan turun yang cukup jelas.
📉 Di bawah pasar, likuiditas likuidasi posisi long terkonsentrasi kuat di rentang 2,610–2,675. Klaster terkuat berada di sekitar 2,635–2,655, dengan beberapa batang di kisaran 140–225 juta USD dan konsentrasi terpadat di sekitar 2,649. Area 2,660–2,675 juga mencakup beberapa batang di kisaran 70–105 juta USD. Jika level 2,690–2,680 ditembus ke bawah, perhatian akan beralih ke 2,670–2,645, lalu 2,630–2,610.
📈 Di atas pasar, likuiditas likuidasi posisi short terkonsentrasi di rentang 2,750–2,805. Klaster terkuat berada di sekitar 2,780–2,795, dengan beberapa batang di kisaran 120–160 juta USD, sementara area 2,755–2,770 juga memiliki kantong likuiditas sekitar 70–100 juta USD. Lebih jauh di atas, rentang 2,810–2,850 masih menampung pita likuiditas penting lainnya.
🧭 Gambaran yang lebih luas lebih mendukung skenario turun karena eksposur likuidasi posisi long di bawah harga lebih besar. Jika level 2,690–2,680 ditembus ke bawah, kemungkinan terjadinya sapuan menuju 2,670–2,645 akan meningkat, disusul 2,630–2,610. Sebaliknya, jika harga menembus 2,735–2,755 ke atas, level 2,780–2,795 akan terekspos, lalu 2,810–2,850.
#LiquidationMap
100
·
--
Bullish
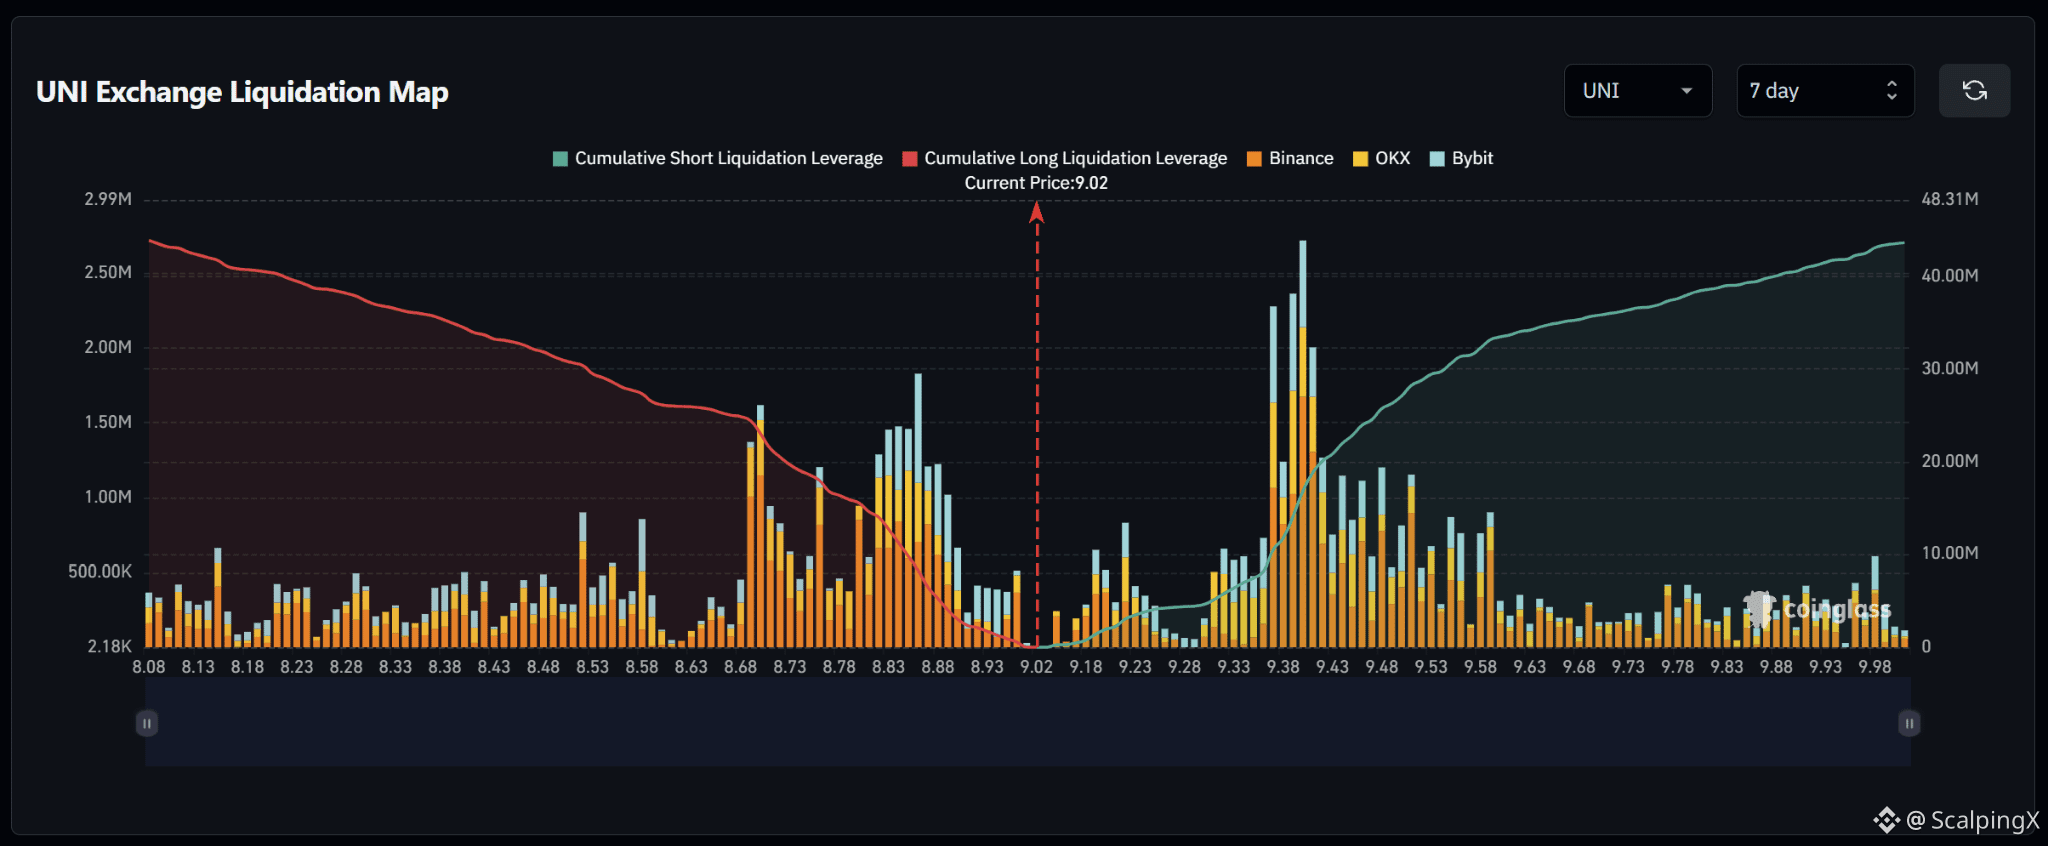
$UNI – Peta Likuidasi (7 Hari) – Harga Saat Ini 9.02
🔎 Peta likuidasi 7 hari relatif seimbang, dengan likuidasi long di bawah dan likuidasi short di atas totalnya kira-kira 42–44 juta USD. Ketidakseimbangan secara keseluruhan terbatas, meskipun sisi kenaikan memiliki beberapa klaster likuidasi individu yang lebih besar.
📉 Di bawah harga pasar, likuiditas likuidasi long terkonsentrasi kuat pada 8.68–8.89. Klaster terkuat berada di sekitar 8.83–8.88 dengan beberapa batang di dekat 1,2–1,8 juta USD, sementara 8.68–8.78 juga berisi beberapa kantong sekitar 1,0–1,6 juta USD. Jika tembus 8.93–8.88, perhatian akan bergeser ke 8.83–8.78 lalu ke 8.73–8.68.
📈 Di atas harga pasar, likuiditas likuidasi short paling berat terkonsentrasi pada 9.33–9.58. Klaster terkuat berada di sekitar 9.37–9.43 dengan beberapa batang di dekat 2,0–2,7 juta USD, sementara 9.45–9.58 terus mempertahankan beberapa kantong sekitar 0,8–1,2 juta USD.
🧭 Setup yang lebih luas terlihat mendekati seimbang. Jika menembus di atas 9.23–9.33, maka klaster utama 9.37–9.43 akan terekspos, lalu 9.48–9.58. Jika kehilangan 8.93–8.88, justru probabilitas akan meningkat untuk sweep menuju 8.83–8.78 dan kemudian 8.73–8.68.
#LiquidationMap
$UNI – Peta Likuidasi (7 Hari) – Harga Saat Ini 9.02
🔎 Peta likuidasi 7 hari relatif seimbang, dengan likuidasi long di bawah dan likuidasi short di atas totalnya kira-kira 42–44 juta USD. Ketidakseimbangan secara keseluruhan terbatas, meskipun sisi kenaikan memiliki beberapa klaster likuidasi individu yang lebih besar.
📉 Di bawah harga pasar, likuiditas likuidasi long terkonsentrasi kuat pada 8.68–8.89. Klaster terkuat berada di sekitar 8.83–8.88 dengan beberapa batang di dekat 1,2–1,8 juta USD, sementara 8.68–8.78 juga berisi beberapa kantong sekitar 1,0–1,6 juta USD. Jika tembus 8.93–8.88, perhatian akan bergeser ke 8.83–8.78 lalu ke 8.73–8.68.
📈 Di atas harga pasar, likuiditas likuidasi short paling berat terkonsentrasi pada 9.33–9.58. Klaster terkuat berada di sekitar 9.37–9.43 dengan beberapa batang di dekat 2,0–2,7 juta USD, sementara 9.45–9.58 terus mempertahankan beberapa kantong sekitar 0,8–1,2 juta USD.
🧭 Setup yang lebih luas terlihat mendekati seimbang. Jika menembus di atas 9.23–9.33, maka klaster utama 9.37–9.43 akan terekspos, lalu 9.48–9.58. Jika kehilangan 8.93–8.88, justru probabilitas akan meningkat untuk sweep menuju 8.83–8.78 dan kemudian 8.73–8.68.
#LiquidationMap
🔎 Peta likuidasi 7 hari relatif seimbang, dengan likuidasi long di bawah dan likuidasi short di atas totalnya kira-kira 42–44 juta USD. Ketidakseimbangan secara keseluruhan terbatas, meskipun sisi kenaikan memiliki beberapa klaster likuidasi individu yang lebih besar.
📉 Di bawah harga pasar, likuiditas likuidasi long terkonsentrasi kuat pada 8.68–8.89. Klaster terkuat berada di sekitar 8.83–8.88 dengan beberapa batang di dekat 1,2–1,8 juta USD, sementara 8.68–8.78 juga berisi beberapa kantong sekitar 1,0–1,6 juta USD. Jika tembus 8.93–8.88, perhatian akan bergeser ke 8.83–8.78 lalu ke 8.73–8.68.
📈 Di atas harga pasar, likuiditas likuidasi short paling berat terkonsentrasi pada 9.33–9.58. Klaster terkuat berada di sekitar 9.37–9.43 dengan beberapa batang di dekat 2,0–2,7 juta USD, sementara 9.45–9.58 terus mempertahankan beberapa kantong sekitar 0,8–1,2 juta USD.
🧭 Setup yang lebih luas terlihat mendekati seimbang. Jika menembus di atas 9.23–9.33, maka klaster utama 9.37–9.43 akan terekspos, lalu 9.48–9.58. Jika kehilangan 8.93–8.88, justru probabilitas akan meningkat untuk sweep menuju 8.83–8.78 dan kemudian 8.73–8.68.
#LiquidationMap
12
·
--
Bullish
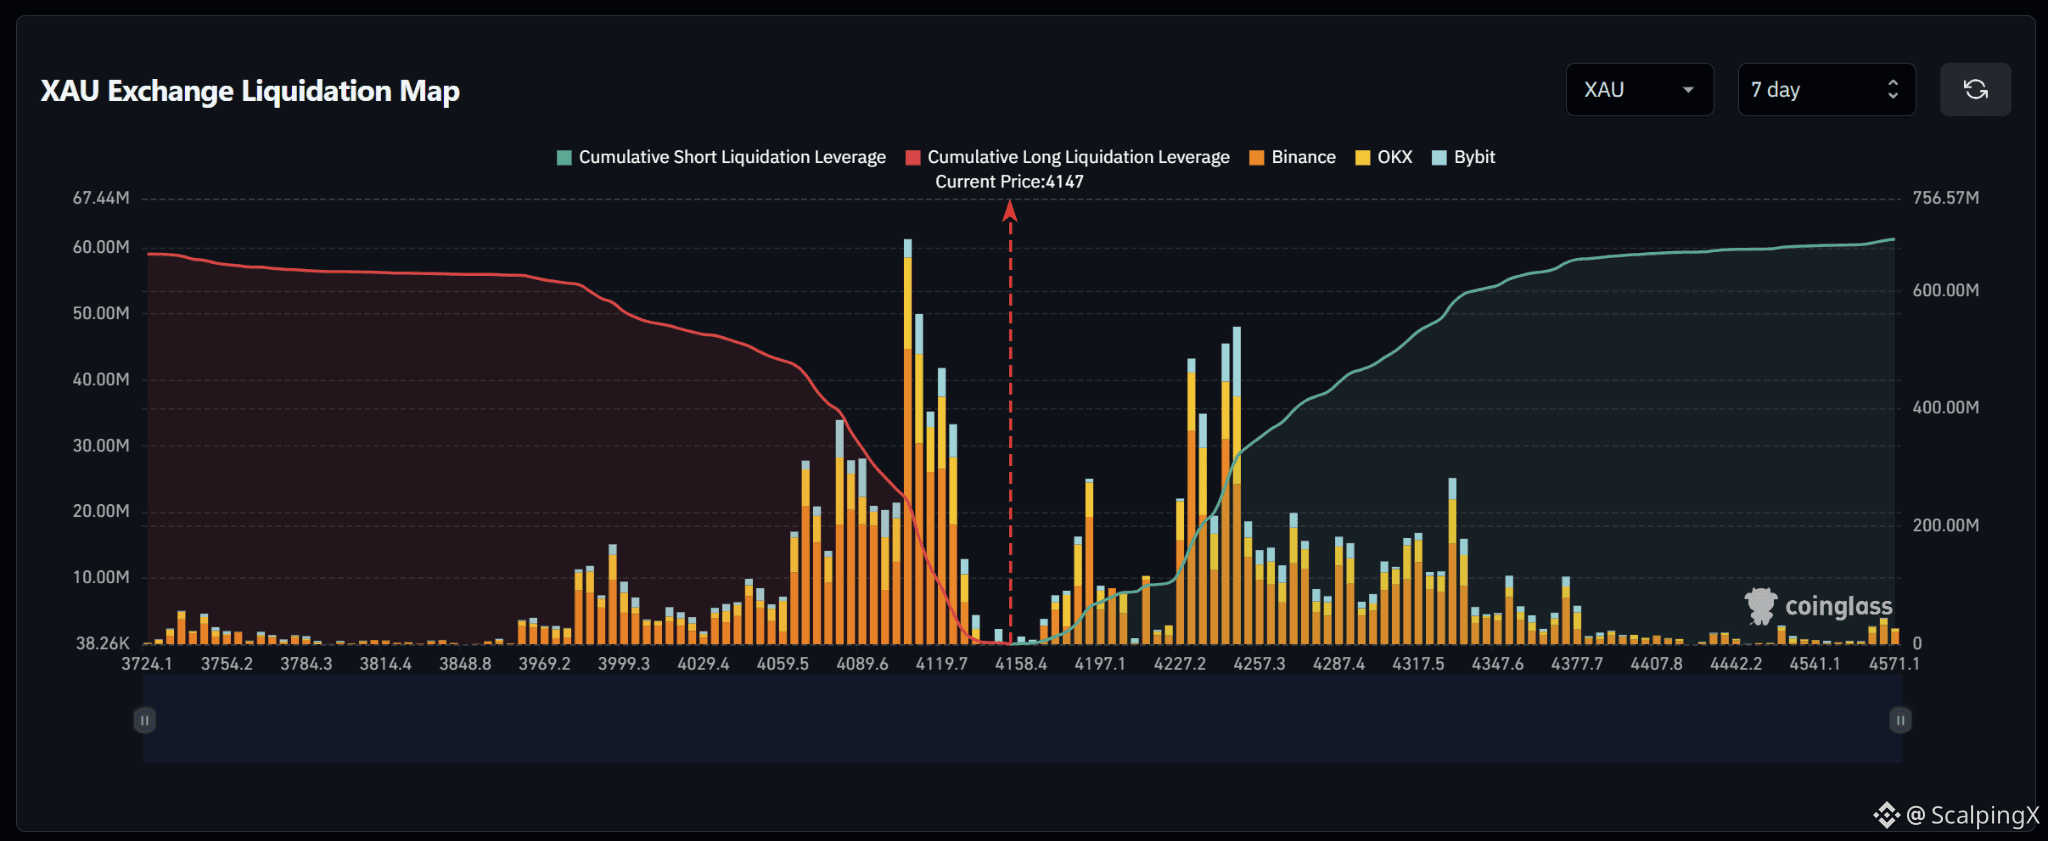
$XAU – Peta Likuidasi (7 Hari) – Harga Saat Ini 4.147
🔎 Peta likuidasi 7 hari relatif seimbang, dengan kisaran sekitar 690–700 juta USD pada likuidasi short di atas harga saat ini, sedikit melebihi sekitar 660–670 juta USD pada likuidasi long di bawah harga. Karena itu, struktur keseluruhannya cenderung sedikit mengarah ke potensi kenaikan (upside) daripada ketidakseimbangan yang kuat.
📉 Di bawah pasar, likuiditas likuidasi long terkonsentrasi dengan kuat pada 4.060–4.120. Klaster terkuat berada di sekitar 4.095–4.115, dengan batang terbesar di atas 60 juta USD; sementara 4.070–4.090 juga berisi beberapa batang sekitar 20–35 juta USD. Jika kehilangan level 4.120–4.110, perhatian akan bergeser ke 4.090–4.070 lalu ke 4.060.
📈 Di atas pasar, likuiditas likuidasi short terkonsentrasi pada 4.220–4.260. Klaster terkuat berada di sekitar 4.230–4.250 dengan beberapa batang sekitar 35–48 juta USD; mendekati harga, 4.190–4.200 memiliki batang sekitar 25 juta USD. Lebih jauh lagi, 4.280–4.340 terus mempertahankan beberapa lapisan likuiditas yang menonjol.
🧭 Setup yang lebih luas nyaris seimbang, tetapi membawa bias kecil ke arah upside. Menembus di atas 4.190–4.200 akan membuka eksposur ke 4.220–4.260, lalu 4.280–4.340. Jika kehilangan 4.120–4.110, justru akan meningkatkan probabilitas sweep menuju 4.090–4.070.
#LiquidationMap
$XAU – Peta Likuidasi (7 Hari) – Harga Saat Ini 4.147
🔎 Peta likuidasi 7 hari relatif seimbang, dengan kisaran sekitar 690–700 juta USD pada likuidasi short di atas harga saat ini, sedikit melebihi sekitar 660–670 juta USD pada likuidasi long di bawah harga. Karena itu, struktur keseluruhannya cenderung sedikit mengarah ke potensi kenaikan (upside) daripada ketidakseimbangan yang kuat.
📉 Di bawah pasar, likuiditas likuidasi long terkonsentrasi dengan kuat pada 4.060–4.120. Klaster terkuat berada di sekitar 4.095–4.115, dengan batang terbesar di atas 60 juta USD; sementara 4.070–4.090 juga berisi beberapa batang sekitar 20–35 juta USD. Jika kehilangan level 4.120–4.110, perhatian akan bergeser ke 4.090–4.070 lalu ke 4.060.
📈 Di atas pasar, likuiditas likuidasi short terkonsentrasi pada 4.220–4.260. Klaster terkuat berada di sekitar 4.230–4.250 dengan beberapa batang sekitar 35–48 juta USD; mendekati harga, 4.190–4.200 memiliki batang sekitar 25 juta USD. Lebih jauh lagi, 4.280–4.340 terus mempertahankan beberapa lapisan likuiditas yang menonjol.
🧭 Setup yang lebih luas nyaris seimbang, tetapi membawa bias kecil ke arah upside. Menembus di atas 4.190–4.200 akan membuka eksposur ke 4.220–4.260, lalu 4.280–4.340. Jika kehilangan 4.120–4.110, justru akan meningkatkan probabilitas sweep menuju 4.090–4.070.
#LiquidationMap
🔎 Peta likuidasi 7 hari relatif seimbang, dengan kisaran sekitar 690–700 juta USD pada likuidasi short di atas harga saat ini, sedikit melebihi sekitar 660–670 juta USD pada likuidasi long di bawah harga. Karena itu, struktur keseluruhannya cenderung sedikit mengarah ke potensi kenaikan (upside) daripada ketidakseimbangan yang kuat.
📉 Di bawah pasar, likuiditas likuidasi long terkonsentrasi dengan kuat pada 4.060–4.120. Klaster terkuat berada di sekitar 4.095–4.115, dengan batang terbesar di atas 60 juta USD; sementara 4.070–4.090 juga berisi beberapa batang sekitar 20–35 juta USD. Jika kehilangan level 4.120–4.110, perhatian akan bergeser ke 4.090–4.070 lalu ke 4.060.
📈 Di atas pasar, likuiditas likuidasi short terkonsentrasi pada 4.220–4.260. Klaster terkuat berada di sekitar 4.230–4.250 dengan beberapa batang sekitar 35–48 juta USD; mendekati harga, 4.190–4.200 memiliki batang sekitar 25 juta USD. Lebih jauh lagi, 4.280–4.340 terus mempertahankan beberapa lapisan likuiditas yang menonjol.
🧭 Setup yang lebih luas nyaris seimbang, tetapi membawa bias kecil ke arah upside. Menembus di atas 4.190–4.200 akan membuka eksposur ke 4.220–4.260, lalu 4.280–4.340. Jika kehilangan 4.120–4.110, justru akan meningkatkan probabilitas sweep menuju 4.090–4.070.
#LiquidationMap
76
·
--
Bullish
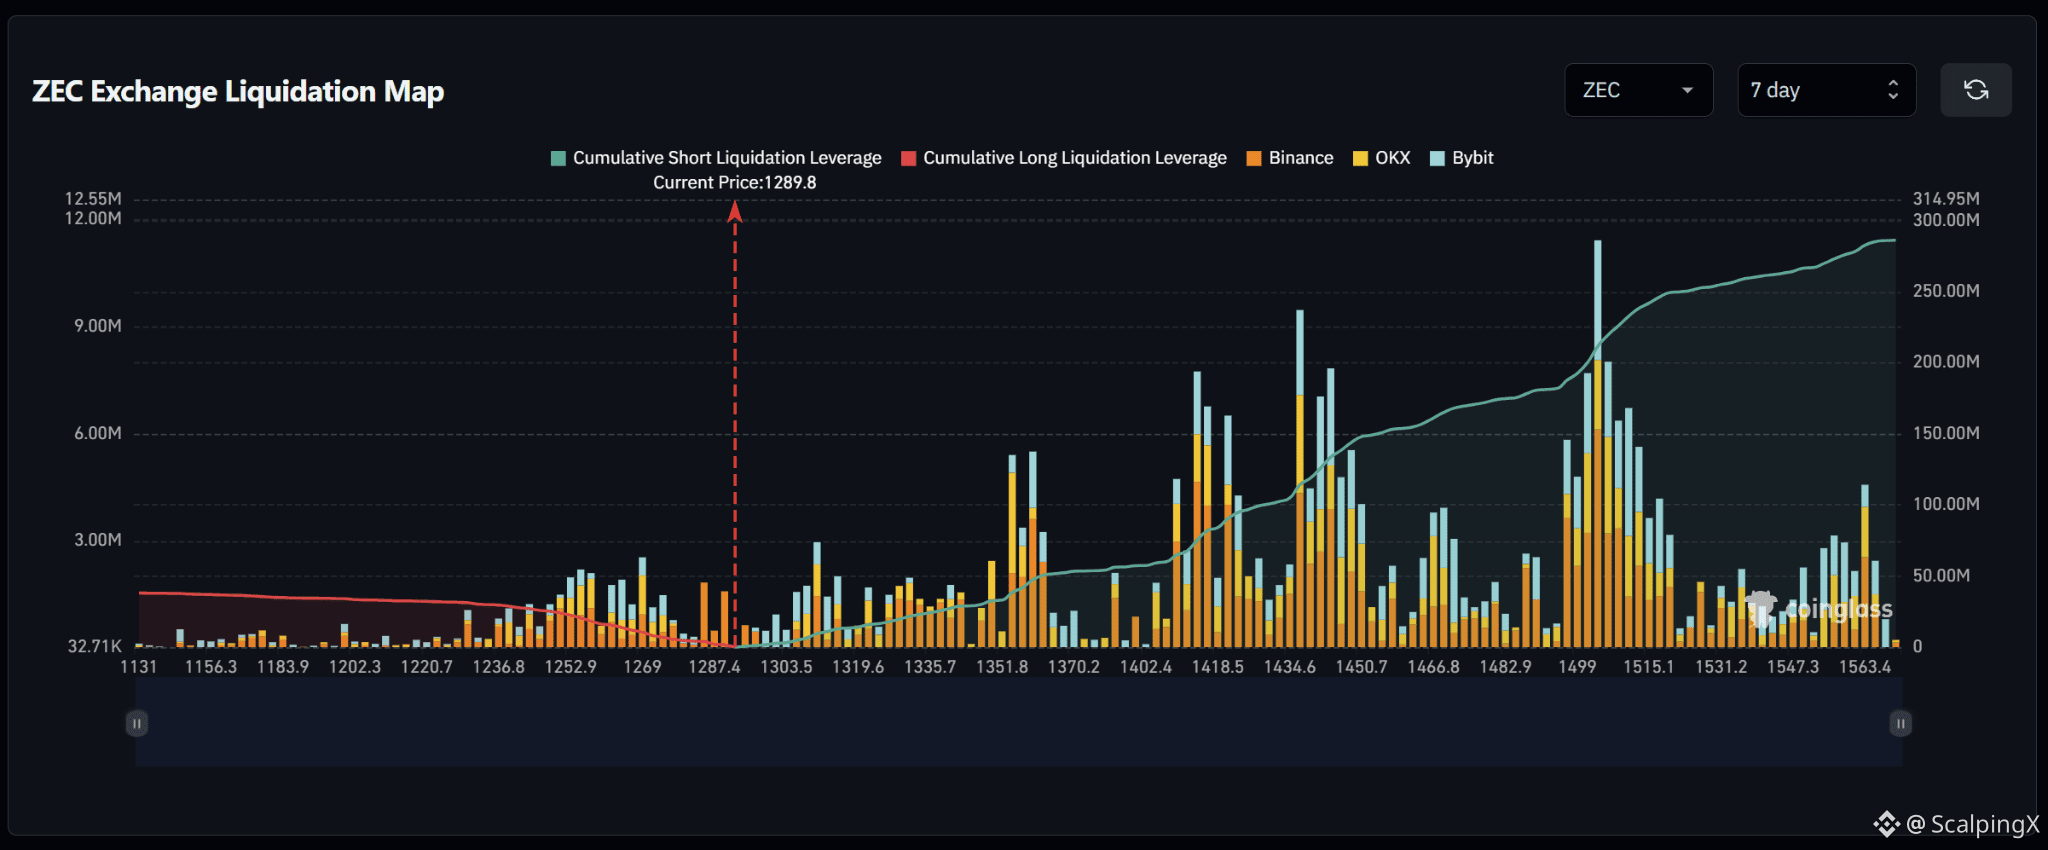
$ZEC – Peta Likuidasi (7 Hari) – Harga Saat Ini 1.289,8
🔎 Peta likuidasi 7 hari menunjukkan kira-kira 280–290 juta USD pada likuidasi short di atas harga saat ini, dan jauh melampaui hanya sekitar 40 juta USD pada likuidasi long di bawahnya. Struktur likuiditas ini sangat mendukung sisi kenaikan, dengan sekitar tujuh kali lebih banyak likuiditas kumulatif di atas pasar.
📉 Di bawah pasar, likuiditas untuk likuidasi long relatif tipis dan terkonsentrasi terutama pada 1.240–1.275. Klaster penting berada di sekitar 1.250–1.270 dengan beberapa batang di kisaran 1,5–2,5 juta USD. Kehilangan 1.287–1.280 akan mengalihkan fokus ke 1.270–1.250, lalu ke 1.235–1.220.
📈 Di atas pasar, likuiditas untuk likuidasi short tersebar sangat besar mulai dari 1.350 ke atas. Klaster utama muncul sekitar 1.410–1.425 dengan beberapa batang di dekat 6–8 juta USD, 1.435–1.450 dengan satu batang sekitar 9,5 juta USD, dan terutama 1.495–1.515, tempat batang terbesar melebihi 11 juta USD.
🧭 Setup yang lebih luas sangat mendukung sisi kenaikan karena eksposur likuidasi short di atas jumlahnya dominan. Menembus di atas 1.320–1.350 akan membuka peluang ke 1.410–1.450, lalu zona likuiditas besar 1.495–1.515. Kehilangan 1.280 justru akan meningkatkan probabilitas sweep menuju 1.270–1.250.
#LiquidationMap
$ZEC – Peta Likuidasi (7 Hari) – Harga Saat Ini 1.289,8
🔎 Peta likuidasi 7 hari menunjukkan kira-kira 280–290 juta USD pada likuidasi short di atas harga saat ini, dan jauh melampaui hanya sekitar 40 juta USD pada likuidasi long di bawahnya. Struktur likuiditas ini sangat mendukung sisi kenaikan, dengan sekitar tujuh kali lebih banyak likuiditas kumulatif di atas pasar.
📉 Di bawah pasar, likuiditas untuk likuidasi long relatif tipis dan terkonsentrasi terutama pada 1.240–1.275. Klaster penting berada di sekitar 1.250–1.270 dengan beberapa batang di kisaran 1,5–2,5 juta USD. Kehilangan 1.287–1.280 akan mengalihkan fokus ke 1.270–1.250, lalu ke 1.235–1.220.
📈 Di atas pasar, likuiditas untuk likuidasi short tersebar sangat besar mulai dari 1.350 ke atas. Klaster utama muncul sekitar 1.410–1.425 dengan beberapa batang di dekat 6–8 juta USD, 1.435–1.450 dengan satu batang sekitar 9,5 juta USD, dan terutama 1.495–1.515, tempat batang terbesar melebihi 11 juta USD.
🧭 Setup yang lebih luas sangat mendukung sisi kenaikan karena eksposur likuidasi short di atas jumlahnya dominan. Menembus di atas 1.320–1.350 akan membuka peluang ke 1.410–1.450, lalu zona likuiditas besar 1.495–1.515. Kehilangan 1.280 justru akan meningkatkan probabilitas sweep menuju 1.270–1.250.
#LiquidationMap
🔎 Peta likuidasi 7 hari menunjukkan kira-kira 280–290 juta USD pada likuidasi short di atas harga saat ini, dan jauh melampaui hanya sekitar 40 juta USD pada likuidasi long di bawahnya. Struktur likuiditas ini sangat mendukung sisi kenaikan, dengan sekitar tujuh kali lebih banyak likuiditas kumulatif di atas pasar.
📉 Di bawah pasar, likuiditas untuk likuidasi long relatif tipis dan terkonsentrasi terutama pada 1.240–1.275. Klaster penting berada di sekitar 1.250–1.270 dengan beberapa batang di kisaran 1,5–2,5 juta USD. Kehilangan 1.287–1.280 akan mengalihkan fokus ke 1.270–1.250, lalu ke 1.235–1.220.
📈 Di atas pasar, likuiditas untuk likuidasi short tersebar sangat besar mulai dari 1.350 ke atas. Klaster utama muncul sekitar 1.410–1.425 dengan beberapa batang di dekat 6–8 juta USD, 1.435–1.450 dengan satu batang sekitar 9,5 juta USD, dan terutama 1.495–1.515, tempat batang terbesar melebihi 11 juta USD.
🧭 Setup yang lebih luas sangat mendukung sisi kenaikan karena eksposur likuidasi short di atas jumlahnya dominan. Menembus di atas 1.320–1.350 akan membuka peluang ke 1.410–1.450, lalu zona likuiditas besar 1.495–1.515. Kehilangan 1.280 justru akan meningkatkan probabilitas sweep menuju 1.270–1.250.
#LiquidationMap
125
·
--
Bullish
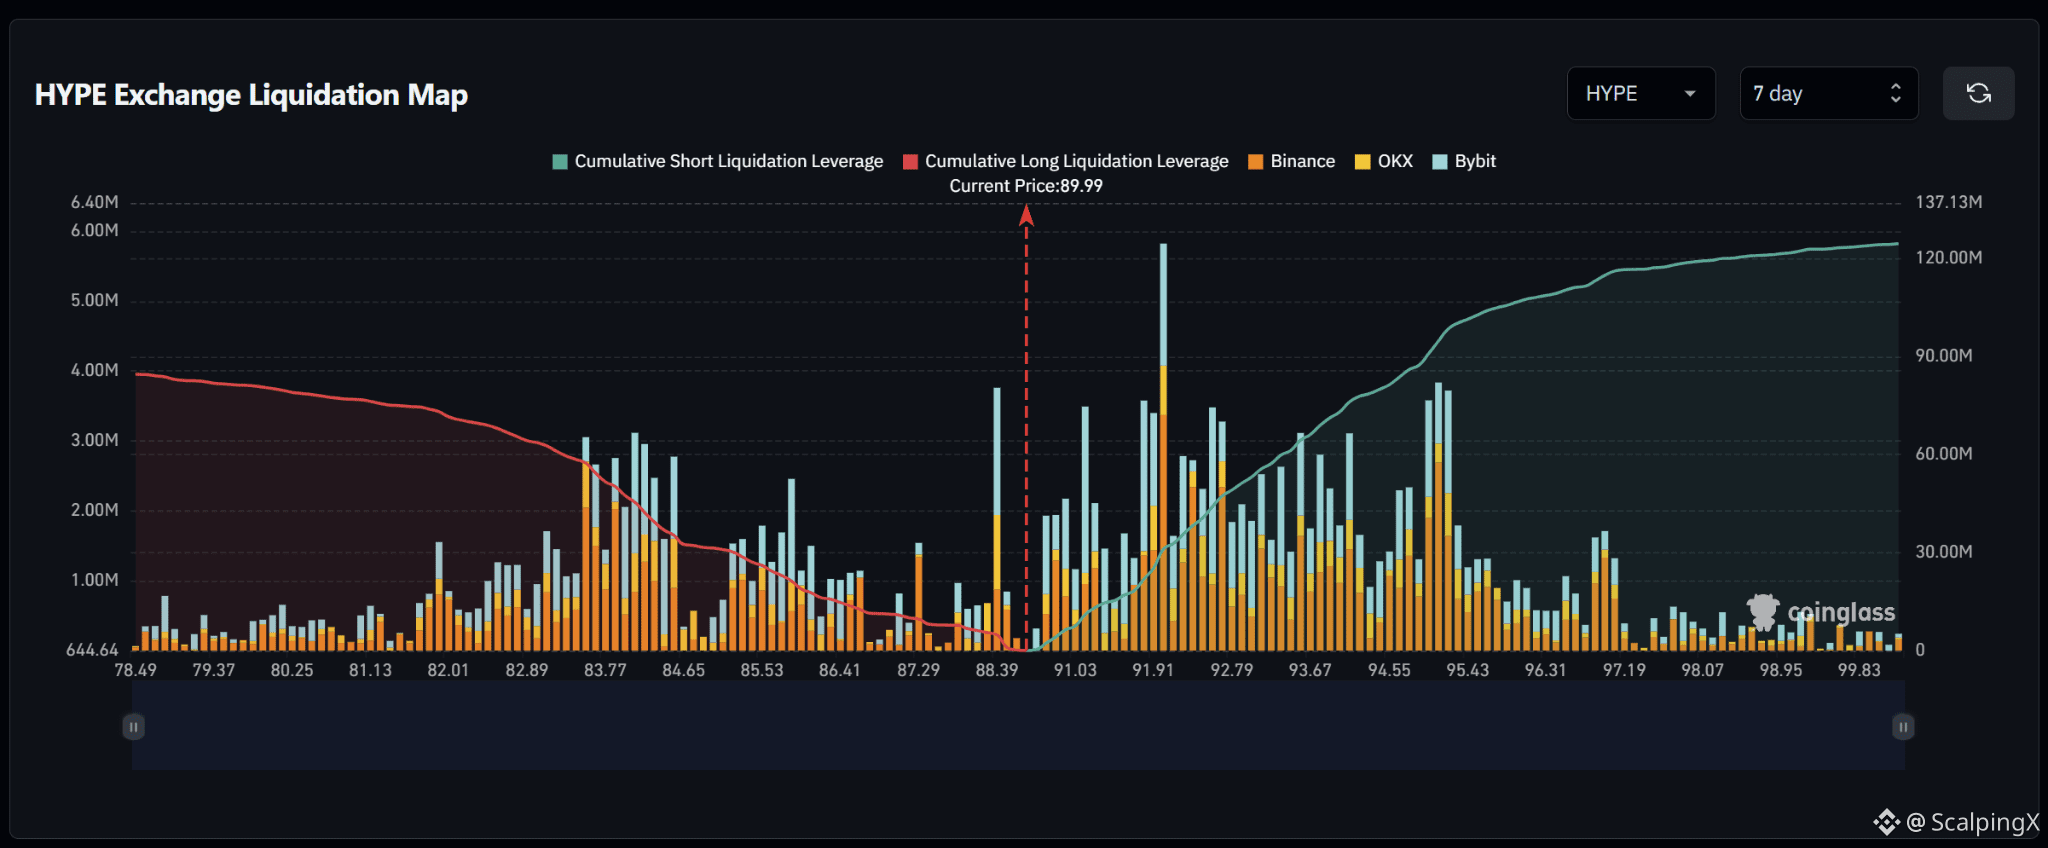
$HYPE – Peta Likuidasi (7 Hari) – Harga Saat Ini 89.99
🔎 Peta likuidasi 7 hari menunjukkan sekitar 120–125 juta USD dalam likuidasi short di atas harga saat ini, jauh melampaui sekitar 85–90 juta USD dalam likuidasi long di bawahnya. Struktur likuiditas karenanya jelas lebih berpihak pada kenaikan (upside), dengan sekitar 1,4 kali lebih banyak likuiditas kumulatif di atas pasar.
📉 Di bawah pasar, likuiditas likuidasi long terkonsentrasi berat pada kisaran 83,3–86,5. Klaster utama berada di sekitar 83,5–84,5 dengan beberapa batang di dekat 2,5–3,1 juta USD, sementara 85,5–86,5 juga berisi beberapa kantong sekitar 1,5–2,5 juta USD. Lebih dekat dengan harga saat ini, 88,3–88,5 menyimpan batang yang lebih besar mendekati 3,7 juta USD.
📈 Di atas pasar, likuiditas likuidasi short meningkat tajam mulai sekitar 91,0 dan terkonsentrasi di seluruh 91,5–95,5. Klaster terkuat berada di sekitar 91,8–92,0 dengan batang mendekati 5,8 juta USD; 92,5–94,0 memuat beberapa batang sekitar 2–3,5 juta USD, sedangkan 94,8–95,3 membentuk klaster kuat lainnya sekitar 3,5–3,8 juta USD.
🧭 Setup yang lebih luas mendukung kenaikan karena eksposur likuidasi short di atas jelas mendominasi. Tembus di atas 91,0–92,0 akan mengekspos 92,8–94,0, lalu 94,8–95,5. Jika jatuh di bawah 88,3–88,0, justru akan meningkatkan probabilitas sweep menuju 86,5–85,5 dan kemudian 84,5–83,5.
#LiquidationMap
$HYPE – Peta Likuidasi (7 Hari) – Harga Saat Ini 89.99
🔎 Peta likuidasi 7 hari menunjukkan sekitar 120–125 juta USD dalam likuidasi short di atas harga saat ini, jauh melampaui sekitar 85–90 juta USD dalam likuidasi long di bawahnya. Struktur likuiditas karenanya jelas lebih berpihak pada kenaikan (upside), dengan sekitar 1,4 kali lebih banyak likuiditas kumulatif di atas pasar.
📉 Di bawah pasar, likuiditas likuidasi long terkonsentrasi berat pada kisaran 83,3–86,5. Klaster utama berada di sekitar 83,5–84,5 dengan beberapa batang di dekat 2,5–3,1 juta USD, sementara 85,5–86,5 juga berisi beberapa kantong sekitar 1,5–2,5 juta USD. Lebih dekat dengan harga saat ini, 88,3–88,5 menyimpan batang yang lebih besar mendekati 3,7 juta USD.
📈 Di atas pasar, likuiditas likuidasi short meningkat tajam mulai sekitar 91,0 dan terkonsentrasi di seluruh 91,5–95,5. Klaster terkuat berada di sekitar 91,8–92,0 dengan batang mendekati 5,8 juta USD; 92,5–94,0 memuat beberapa batang sekitar 2–3,5 juta USD, sedangkan 94,8–95,3 membentuk klaster kuat lainnya sekitar 3,5–3,8 juta USD.
🧭 Setup yang lebih luas mendukung kenaikan karena eksposur likuidasi short di atas jelas mendominasi. Tembus di atas 91,0–92,0 akan mengekspos 92,8–94,0, lalu 94,8–95,5. Jika jatuh di bawah 88,3–88,0, justru akan meningkatkan probabilitas sweep menuju 86,5–85,5 dan kemudian 84,5–83,5.
#LiquidationMap
🔎 Peta likuidasi 7 hari menunjukkan sekitar 120–125 juta USD dalam likuidasi short di atas harga saat ini, jauh melampaui sekitar 85–90 juta USD dalam likuidasi long di bawahnya. Struktur likuiditas karenanya jelas lebih berpihak pada kenaikan (upside), dengan sekitar 1,4 kali lebih banyak likuiditas kumulatif di atas pasar.
📉 Di bawah pasar, likuiditas likuidasi long terkonsentrasi berat pada kisaran 83,3–86,5. Klaster utama berada di sekitar 83,5–84,5 dengan beberapa batang di dekat 2,5–3,1 juta USD, sementara 85,5–86,5 juga berisi beberapa kantong sekitar 1,5–2,5 juta USD. Lebih dekat dengan harga saat ini, 88,3–88,5 menyimpan batang yang lebih besar mendekati 3,7 juta USD.
📈 Di atas pasar, likuiditas likuidasi short meningkat tajam mulai sekitar 91,0 dan terkonsentrasi di seluruh 91,5–95,5. Klaster terkuat berada di sekitar 91,8–92,0 dengan batang mendekati 5,8 juta USD; 92,5–94,0 memuat beberapa batang sekitar 2–3,5 juta USD, sedangkan 94,8–95,3 membentuk klaster kuat lainnya sekitar 3,5–3,8 juta USD.
🧭 Setup yang lebih luas mendukung kenaikan karena eksposur likuidasi short di atas jelas mendominasi. Tembus di atas 91,0–92,0 akan mengekspos 92,8–94,0, lalu 94,8–95,5. Jika jatuh di bawah 88,3–88,0, justru akan meningkatkan probabilitas sweep menuju 86,5–85,5 dan kemudian 84,5–83,5.
#LiquidationMap
45
·
--
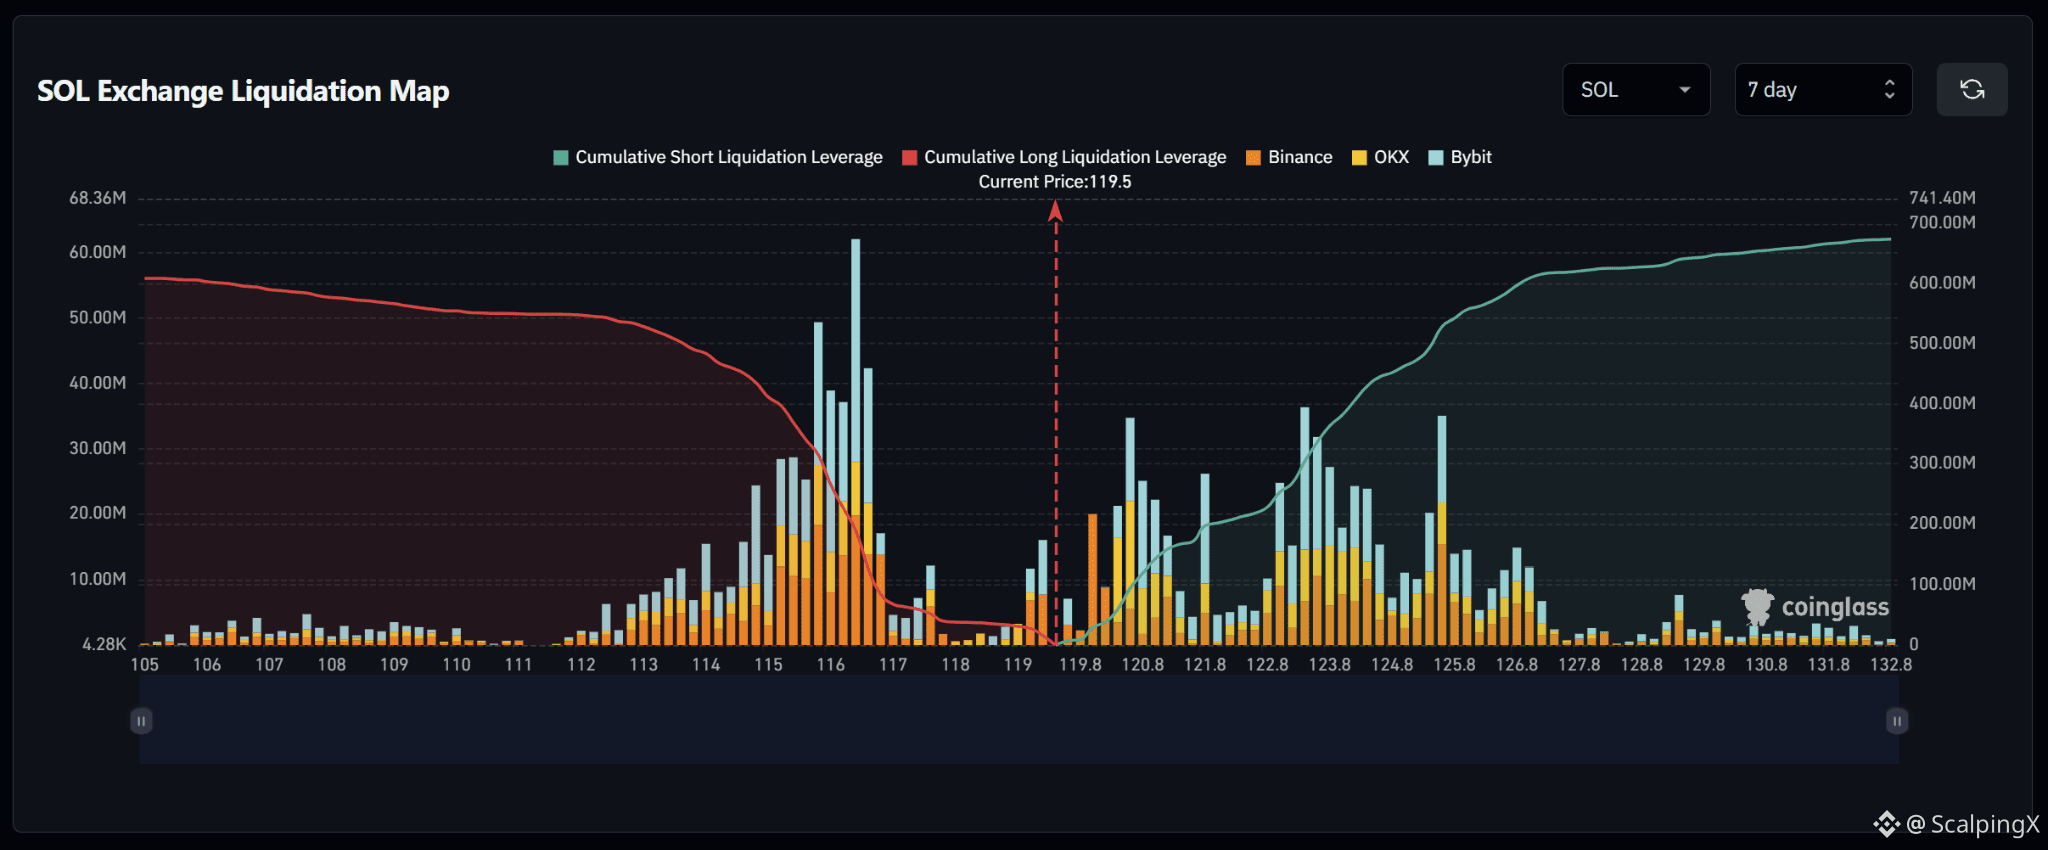
$SOL – Peta Likuidasi (7 Hari) – Harga Saat Ini 119.5
🔎 Peta likuidasi 7 hari saat ini hampir seimbang, dengan likuidasi long di bawah dan likuidasi short di atas totalnya masing-masing sekitar 600–620 juta USD. Ketidakseimbangan secara keseluruhan terbatas, sehingga klaster likuiditas terdekat menjadi lebih penting untuk tarikan arah.
📉 Di bawah pasar, likuiditas likuidasi long terkonsentrasi kuat pada kisaran 115–117. Klaster terkuat berada di sekitar 116.0–116.5 dengan batang di atas 60 juta USD, sedangkan 115.0–115.8 juga memuat beberapa batang sekitar 25–50 juta USD. Jika 119.0 hilang, perhatian akan bergeser ke 117.5–116.8 lalu 116.0–115.0.
📈 Di atas pasar, likuiditas likuidasi short terlihat meningkat dari area 120, dengan konsentrasi di sekitar 120.4–121.8, 122.8–124.3, dan 125.0–126.0. Batang terbesar di sekitar 120.5, 123.4, dan 125.5 mencapai sekitar 35 juta USD, sehingga membentuk beberapa lapisan likuiditas berurutan di atas.
🧭 Setup yang lebih luas saat ini dekat dengan seimbang. Penembusan di atas 120.0–120.8 akan memperlihatkan 121.8, lalu 123.0–124.0 dan 125.0–126.0. Jika 119.0 hilang, justru peluang terjadinya sweep menuju 117.5–116.8 dan kemudian 116.0–115.0 akan meningkat.
#LiquidationMap
$SOL – Peta Likuidasi (7 Hari) – Harga Saat Ini 119.5
🔎 Peta likuidasi 7 hari saat ini hampir seimbang, dengan likuidasi long di bawah dan likuidasi short di atas totalnya masing-masing sekitar 600–620 juta USD. Ketidakseimbangan secara keseluruhan terbatas, sehingga klaster likuiditas terdekat menjadi lebih penting untuk tarikan arah.
📉 Di bawah pasar, likuiditas likuidasi long terkonsentrasi kuat pada kisaran 115–117. Klaster terkuat berada di sekitar 116.0–116.5 dengan batang di atas 60 juta USD, sedangkan 115.0–115.8 juga memuat beberapa batang sekitar 25–50 juta USD. Jika 119.0 hilang, perhatian akan bergeser ke 117.5–116.8 lalu 116.0–115.0.
📈 Di atas pasar, likuiditas likuidasi short terlihat meningkat dari area 120, dengan konsentrasi di sekitar 120.4–121.8, 122.8–124.3, dan 125.0–126.0. Batang terbesar di sekitar 120.5, 123.4, dan 125.5 mencapai sekitar 35 juta USD, sehingga membentuk beberapa lapisan likuiditas berurutan di atas.
🧭 Setup yang lebih luas saat ini dekat dengan seimbang. Penembusan di atas 120.0–120.8 akan memperlihatkan 121.8, lalu 123.0–124.0 dan 125.0–126.0. Jika 119.0 hilang, justru peluang terjadinya sweep menuju 117.5–116.8 dan kemudian 116.0–115.0 akan meningkat.
#LiquidationMap
🔎 Peta likuidasi 7 hari saat ini hampir seimbang, dengan likuidasi long di bawah dan likuidasi short di atas totalnya masing-masing sekitar 600–620 juta USD. Ketidakseimbangan secara keseluruhan terbatas, sehingga klaster likuiditas terdekat menjadi lebih penting untuk tarikan arah.
📉 Di bawah pasar, likuiditas likuidasi long terkonsentrasi kuat pada kisaran 115–117. Klaster terkuat berada di sekitar 116.0–116.5 dengan batang di atas 60 juta USD, sedangkan 115.0–115.8 juga memuat beberapa batang sekitar 25–50 juta USD. Jika 119.0 hilang, perhatian akan bergeser ke 117.5–116.8 lalu 116.0–115.0.
📈 Di atas pasar, likuiditas likuidasi short terlihat meningkat dari area 120, dengan konsentrasi di sekitar 120.4–121.8, 122.8–124.3, dan 125.0–126.0. Batang terbesar di sekitar 120.5, 123.4, dan 125.5 mencapai sekitar 35 juta USD, sehingga membentuk beberapa lapisan likuiditas berurutan di atas.
🧭 Setup yang lebih luas saat ini dekat dengan seimbang. Penembusan di atas 120.0–120.8 akan memperlihatkan 121.8, lalu 123.0–124.0 dan 125.0–126.0. Jika 119.0 hilang, justru peluang terjadinya sweep menuju 117.5–116.8 dan kemudian 116.0–115.0 akan meningkat.
#LiquidationMap
87
·
--
Bullish
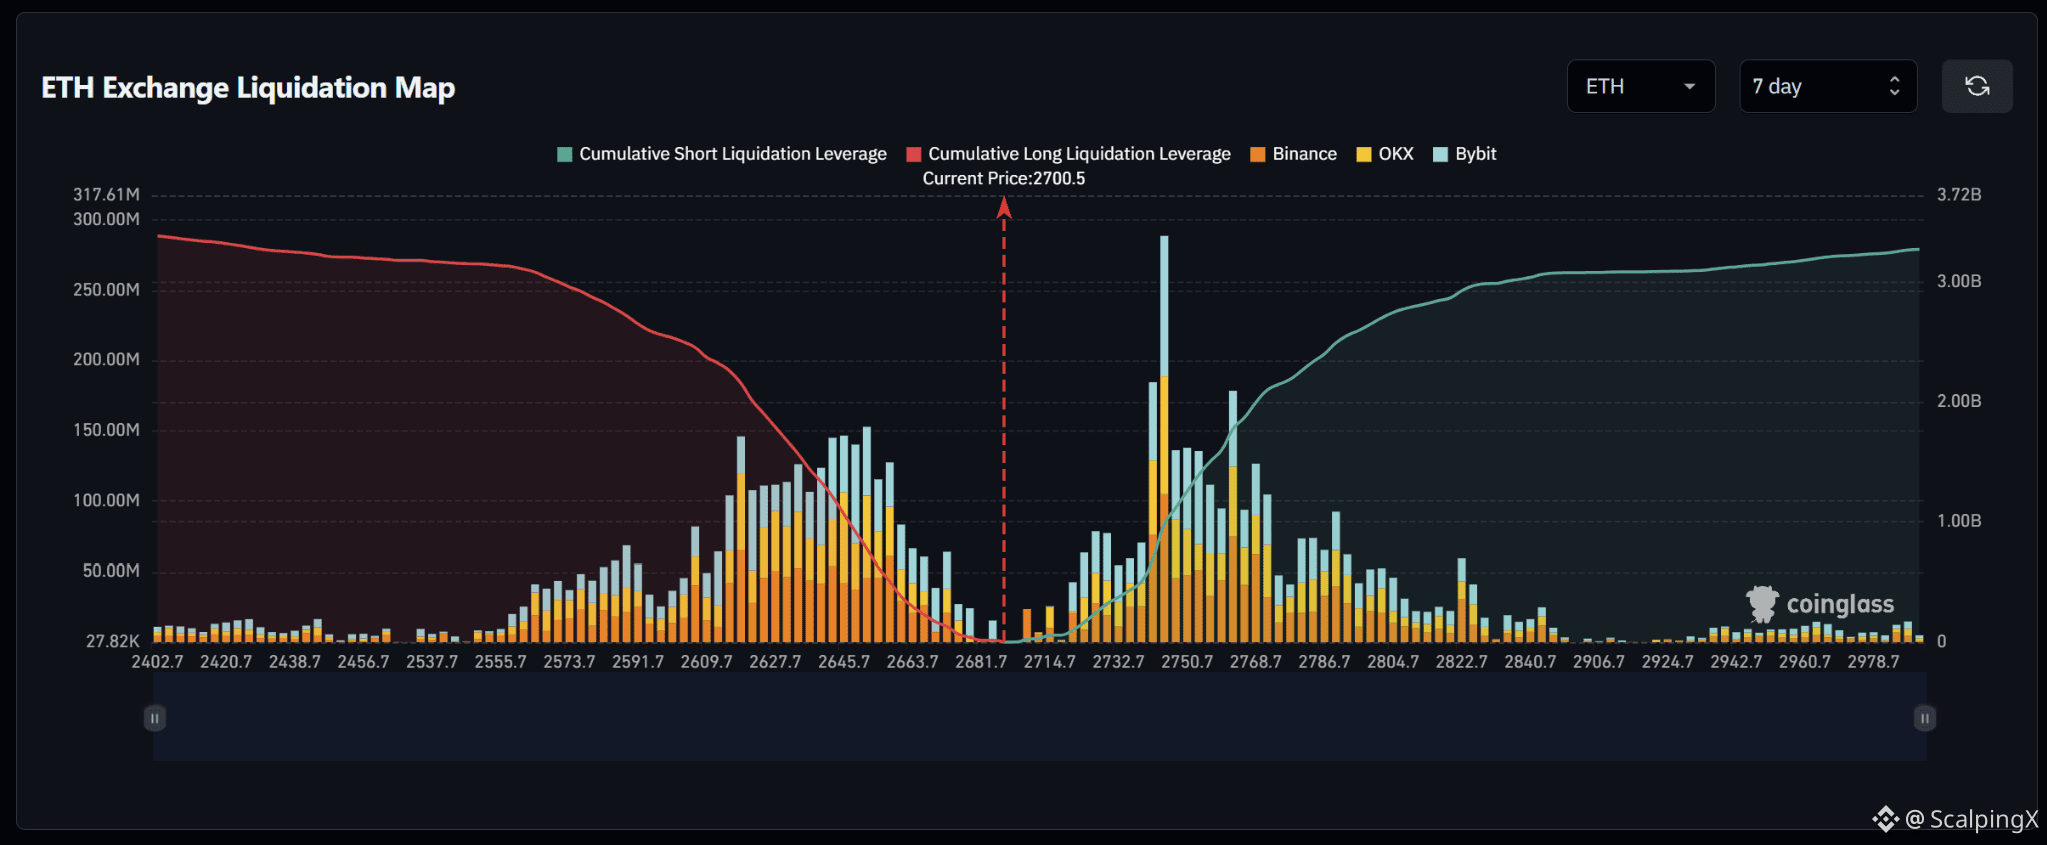
$ETH – Peta Likuidasi (7 Hari) – Harga Saat Ini 2,700.5
🔎 Peta likuidasi 7 hari relatif seimbang, dengan sekitar 3,3 miliar USD likuidasi long di bawah harga saat ini dan sekitar 3,2–3,3 miliar USD likuidasi short di atas. Eksposur likuidasi long sedikit lebih besar, sehingga strukturnya condong sedikit ke penurunan, bukan ketidakseimbangan yang kuat.
📉 Di bawah pasar, likuiditas likuidasi long terkonsentrasi kuat di 2,610–2,660. Klaster terkuat berada sekitar 2,625–2,650 dengan beberapa batang di sekitar 110–150 juta USD, sementara 2,610–2,630 juga membawa likuiditas yang padat. Jika kehilangan 2,681 akan mengalihkan perhatian ke 2,663–2,645 lalu 2,628–2,610.
📈 Di atas pasar, likuiditas likuidasi short terkonsentrasi kuat di 2,730–2,770. Klaster terkuat berada sekitar 2,745–2,750 dengan satu batang sekitar 290 juta USD, sedangkan 2,755–2,770 juga memuat beberapa batang di kisaran 100–180 juta USD. Lebih jauh lagi, 2,780–2,825 terus mempertahankan satu pita likuiditas yang cukup menonjol.
🧭 Setup yang lebih luas mendekati seimbang, namun membawa kecenderungan turun yang ringan. Kehilangan 2,681 akan meningkatkan probabilitas adanya sapuan menuju 2,663–2,645, lalu 2,628–2,610. Jika justru menembus di atas 2,714–2,733, maka akan membuka eksposur ke 2,745–2,770 dan kemudian 2,786–2,823.
#LiquidationMap
$ETH – Peta Likuidasi (7 Hari) – Harga Saat Ini 2,700.5
🔎 Peta likuidasi 7 hari relatif seimbang, dengan sekitar 3,3 miliar USD likuidasi long di bawah harga saat ini dan sekitar 3,2–3,3 miliar USD likuidasi short di atas. Eksposur likuidasi long sedikit lebih besar, sehingga strukturnya condong sedikit ke penurunan, bukan ketidakseimbangan yang kuat.
📉 Di bawah pasar, likuiditas likuidasi long terkonsentrasi kuat di 2,610–2,660. Klaster terkuat berada sekitar 2,625–2,650 dengan beberapa batang di sekitar 110–150 juta USD, sementara 2,610–2,630 juga membawa likuiditas yang padat. Jika kehilangan 2,681 akan mengalihkan perhatian ke 2,663–2,645 lalu 2,628–2,610.
📈 Di atas pasar, likuiditas likuidasi short terkonsentrasi kuat di 2,730–2,770. Klaster terkuat berada sekitar 2,745–2,750 dengan satu batang sekitar 290 juta USD, sedangkan 2,755–2,770 juga memuat beberapa batang di kisaran 100–180 juta USD. Lebih jauh lagi, 2,780–2,825 terus mempertahankan satu pita likuiditas yang cukup menonjol.
🧭 Setup yang lebih luas mendekati seimbang, namun membawa kecenderungan turun yang ringan. Kehilangan 2,681 akan meningkatkan probabilitas adanya sapuan menuju 2,663–2,645, lalu 2,628–2,610. Jika justru menembus di atas 2,714–2,733, maka akan membuka eksposur ke 2,745–2,770 dan kemudian 2,786–2,823.
#LiquidationMap
🔎 Peta likuidasi 7 hari relatif seimbang, dengan sekitar 3,3 miliar USD likuidasi long di bawah harga saat ini dan sekitar 3,2–3,3 miliar USD likuidasi short di atas. Eksposur likuidasi long sedikit lebih besar, sehingga strukturnya condong sedikit ke penurunan, bukan ketidakseimbangan yang kuat.
📉 Di bawah pasar, likuiditas likuidasi long terkonsentrasi kuat di 2,610–2,660. Klaster terkuat berada sekitar 2,625–2,650 dengan beberapa batang di sekitar 110–150 juta USD, sementara 2,610–2,630 juga membawa likuiditas yang padat. Jika kehilangan 2,681 akan mengalihkan perhatian ke 2,663–2,645 lalu 2,628–2,610.
📈 Di atas pasar, likuiditas likuidasi short terkonsentrasi kuat di 2,730–2,770. Klaster terkuat berada sekitar 2,745–2,750 dengan satu batang sekitar 290 juta USD, sedangkan 2,755–2,770 juga memuat beberapa batang di kisaran 100–180 juta USD. Lebih jauh lagi, 2,780–2,825 terus mempertahankan satu pita likuiditas yang cukup menonjol.
🧭 Setup yang lebih luas mendekati seimbang, namun membawa kecenderungan turun yang ringan. Kehilangan 2,681 akan meningkatkan probabilitas adanya sapuan menuju 2,663–2,645, lalu 2,628–2,610. Jika justru menembus di atas 2,714–2,733, maka akan membuka eksposur ke 2,745–2,770 dan kemudian 2,786–2,823.
#LiquidationMap
75
·
--
Bullish
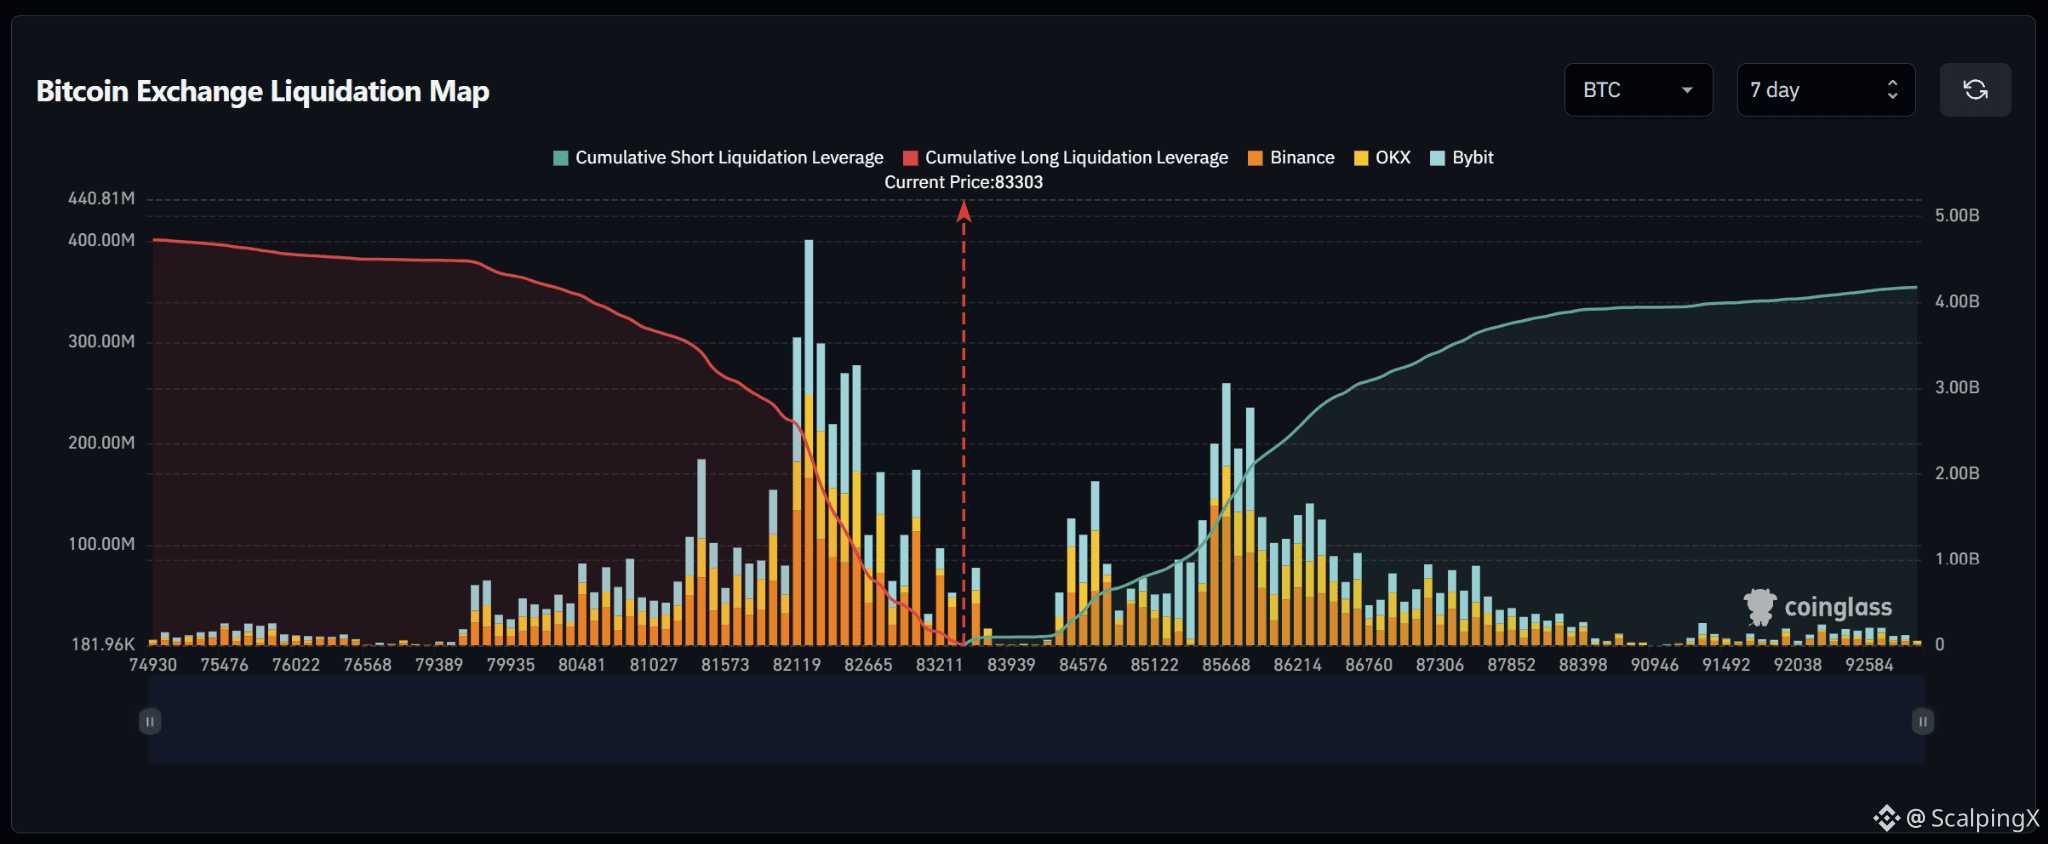
$BTC – Peta Likuidasi (7 Hari) – Harga Saat Ini 83,303
🔎 Peta likuidasi 7 hari menunjukkan sekitar 4,6–4,7 miliar USD dalam likuidasi long di bawah harga saat ini, sedikit melampaui sekitar 4,1 miliar USD dalam likuidasi short di atas. Struktur likuiditas karenanya relatif seimbang dengan kecenderungan turun yang ringan.
📉 Di bawah pasar, likuiditas likuidasi long terkonsentrasi paling berat di 81,500–82,700. Klaster terkuat berada di sekitar 82,100–82,600 dengan beberapa batang di kisaran 200–400 juta USD, dengan konsentrasi terpadat di sekitar 82,200–82,400. Jika 83,200 hilang, perhatian akan bergeser ke 82,700–82,100 lalu ke 81,600–81,000.
📈 Di atas pasar, likuiditas likuidasi short mulai terbentuk dari sekitar 84,500 dan menjadi terkonsentrasi di 85,500–86,300. Klaster terkuat berada di sekitar 85,600–85,900 dengan batang sekitar 200–260 juta USD, sementara 86,000–86,700 terus menahan beberapa kantong sekitar 100–150 juta USD.
🧭 Setup yang lebih luas terlihat mendekati seimbang, tetapi membawa kecenderungan turun yang ringan karena eksposur likuidasi long di bawah sedikit lebih besar. Kehilangan 83,200 akan meningkatkan probabilitas sweep menuju 82,700–82,100, lalu 81,600–81,000. Jika justru menembus ke atas 84,500–85,100, maka yang akan terekspos adalah 85,600–86,300 lalu 86,700–87,300.
#LiquidationMap
$BTC – Peta Likuidasi (7 Hari) – Harga Saat Ini 83,303
🔎 Peta likuidasi 7 hari menunjukkan sekitar 4,6–4,7 miliar USD dalam likuidasi long di bawah harga saat ini, sedikit melampaui sekitar 4,1 miliar USD dalam likuidasi short di atas. Struktur likuiditas karenanya relatif seimbang dengan kecenderungan turun yang ringan.
📉 Di bawah pasar, likuiditas likuidasi long terkonsentrasi paling berat di 81,500–82,700. Klaster terkuat berada di sekitar 82,100–82,600 dengan beberapa batang di kisaran 200–400 juta USD, dengan konsentrasi terpadat di sekitar 82,200–82,400. Jika 83,200 hilang, perhatian akan bergeser ke 82,700–82,100 lalu ke 81,600–81,000.
📈 Di atas pasar, likuiditas likuidasi short mulai terbentuk dari sekitar 84,500 dan menjadi terkonsentrasi di 85,500–86,300. Klaster terkuat berada di sekitar 85,600–85,900 dengan batang sekitar 200–260 juta USD, sementara 86,000–86,700 terus menahan beberapa kantong sekitar 100–150 juta USD.
🧭 Setup yang lebih luas terlihat mendekati seimbang, tetapi membawa kecenderungan turun yang ringan karena eksposur likuidasi long di bawah sedikit lebih besar. Kehilangan 83,200 akan meningkatkan probabilitas sweep menuju 82,700–82,100, lalu 81,600–81,000. Jika justru menembus ke atas 84,500–85,100, maka yang akan terekspos adalah 85,600–86,300 lalu 86,700–87,300.
#LiquidationMap
🔎 Peta likuidasi 7 hari menunjukkan sekitar 4,6–4,7 miliar USD dalam likuidasi long di bawah harga saat ini, sedikit melampaui sekitar 4,1 miliar USD dalam likuidasi short di atas. Struktur likuiditas karenanya relatif seimbang dengan kecenderungan turun yang ringan.
📉 Di bawah pasar, likuiditas likuidasi long terkonsentrasi paling berat di 81,500–82,700. Klaster terkuat berada di sekitar 82,100–82,600 dengan beberapa batang di kisaran 200–400 juta USD, dengan konsentrasi terpadat di sekitar 82,200–82,400. Jika 83,200 hilang, perhatian akan bergeser ke 82,700–82,100 lalu ke 81,600–81,000.
📈 Di atas pasar, likuiditas likuidasi short mulai terbentuk dari sekitar 84,500 dan menjadi terkonsentrasi di 85,500–86,300. Klaster terkuat berada di sekitar 85,600–85,900 dengan batang sekitar 200–260 juta USD, sementara 86,000–86,700 terus menahan beberapa kantong sekitar 100–150 juta USD.
🧭 Setup yang lebih luas terlihat mendekati seimbang, tetapi membawa kecenderungan turun yang ringan karena eksposur likuidasi long di bawah sedikit lebih besar. Kehilangan 83,200 akan meningkatkan probabilitas sweep menuju 82,700–82,100, lalu 81,600–81,000. Jika justru menembus ke atas 84,500–85,100, maka yang akan terekspos adalah 85,600–86,300 lalu 86,700–87,300.
#LiquidationMap
1
103
·
--
Bullish
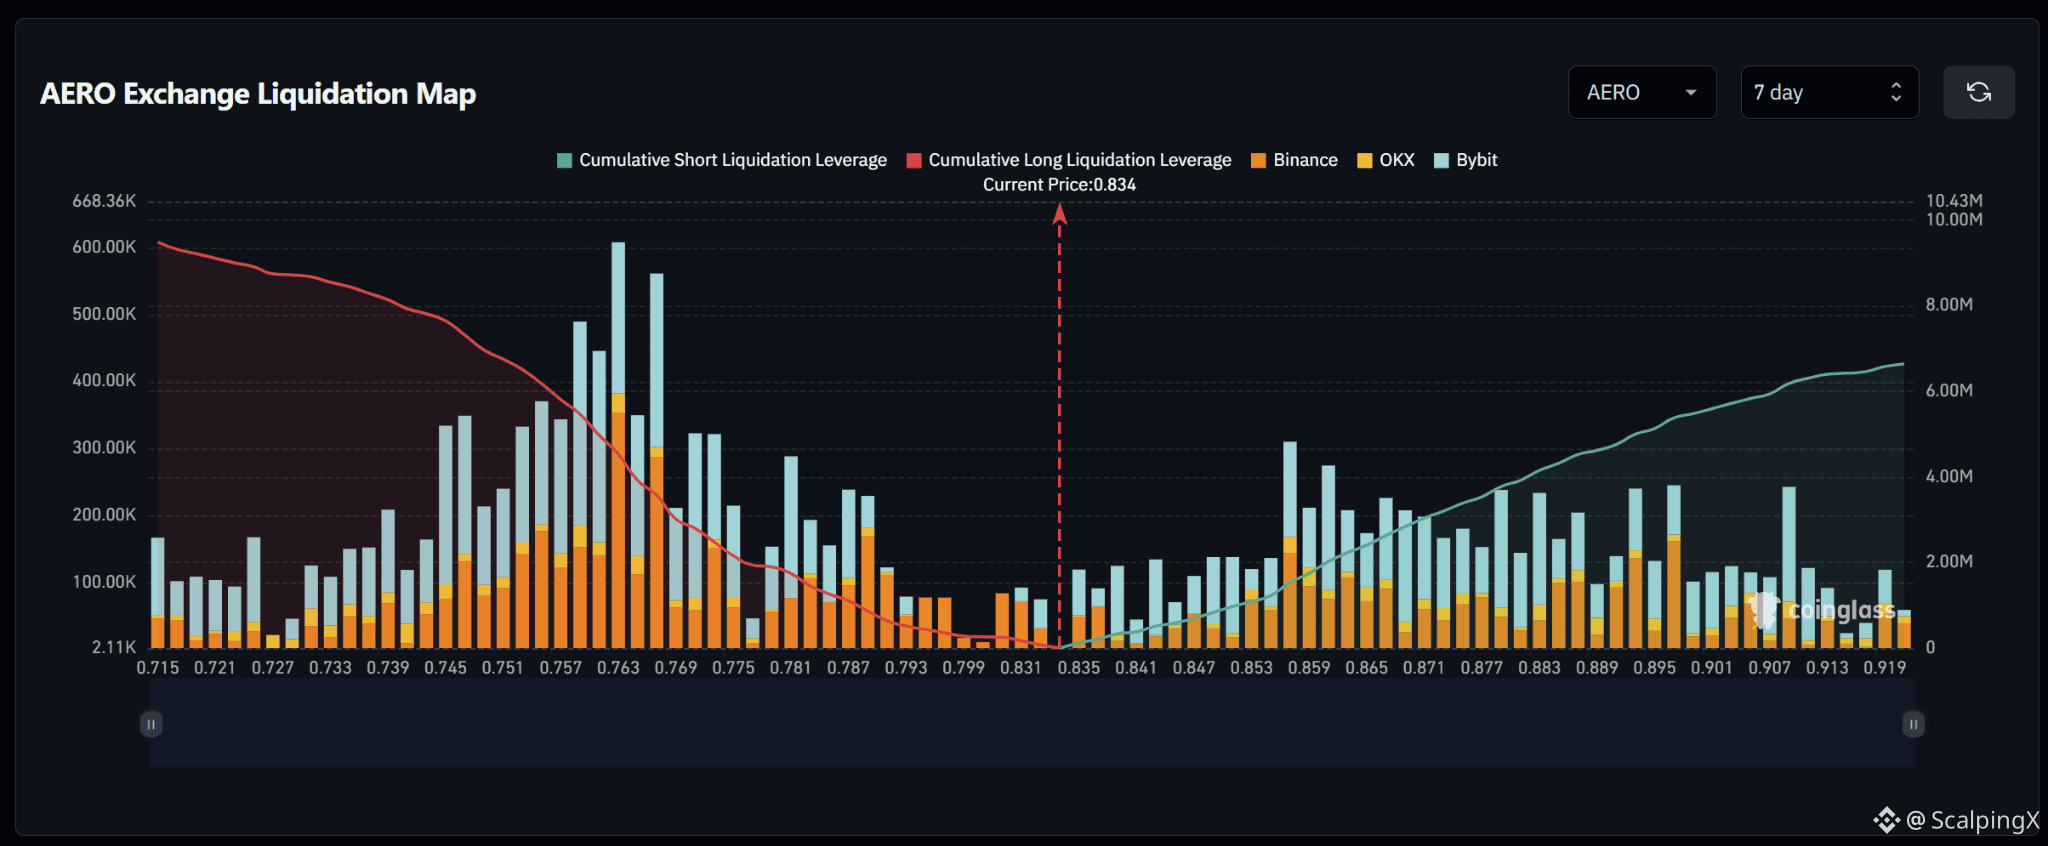
$AERO – Peta Likuidasi (7 Hari) – Harga Saat Ini 0.834
🔎 Peta likuidasi 7 hari menunjukkan perkiraan 9,5–10 juta USD dalam likuidasi long di bawah harga saat ini, melebihi sekitar 6–6,5 juta USD dalam likuidasi short di atas. Struktur likuiditas karenanya lebih menguntungkan sisi penurunan, dengan sekitar 1,5 kali lebih banyak likuiditas kumulatif di bawah pasar.
📉 Di bawah pasar, likuiditas likuidasi long terkonsentrasi kuat di kisaran 0.745–0.775. Klaster terkuat berada sekitar 0.757–0.769 dengan beberapa batang di dekat 0.35–0.60 juta USD, sementara konsentrasi paling padat berada di sekitar 0.762–0.768. Kehilangan 0.831 akan mengalihkan fokus ke 0.799–0.787, lalu 0.775–0.757.
📈 Di atas pasar, likuiditas likuidasi short terbagi dengan kuat di kisaran 0.853–0.899. Klaster yang menonjol muncul sekitar 0.857–0.871 dengan beberapa batang di dekat 0.20–0.31 juta USD, sedangkan 0.883–0.899 juga berisi beberapa kantong sekitar 0.20–0.25 juta USD.
🧭 Setup yang lebih luas lebih mendukung penurunan karena eksposur likuidasi long di bawah lebih besar. Kehilangan 0.831 akan meningkatkan probabilitas adanya sweep menuju 0.799–0.787, lalu 0.775–0.757. Jika menembus di atas 0.853–0.859, sebaliknya akan mengekspos 0.865–0.871 dan kemudian 0.883–0.899.
#LiquidationMap
$AERO – Peta Likuidasi (7 Hari) – Harga Saat Ini 0.834
🔎 Peta likuidasi 7 hari menunjukkan perkiraan 9,5–10 juta USD dalam likuidasi long di bawah harga saat ini, melebihi sekitar 6–6,5 juta USD dalam likuidasi short di atas. Struktur likuiditas karenanya lebih menguntungkan sisi penurunan, dengan sekitar 1,5 kali lebih banyak likuiditas kumulatif di bawah pasar.
📉 Di bawah pasar, likuiditas likuidasi long terkonsentrasi kuat di kisaran 0.745–0.775. Klaster terkuat berada sekitar 0.757–0.769 dengan beberapa batang di dekat 0.35–0.60 juta USD, sementara konsentrasi paling padat berada di sekitar 0.762–0.768. Kehilangan 0.831 akan mengalihkan fokus ke 0.799–0.787, lalu 0.775–0.757.
📈 Di atas pasar, likuiditas likuidasi short terbagi dengan kuat di kisaran 0.853–0.899. Klaster yang menonjol muncul sekitar 0.857–0.871 dengan beberapa batang di dekat 0.20–0.31 juta USD, sedangkan 0.883–0.899 juga berisi beberapa kantong sekitar 0.20–0.25 juta USD.
🧭 Setup yang lebih luas lebih mendukung penurunan karena eksposur likuidasi long di bawah lebih besar. Kehilangan 0.831 akan meningkatkan probabilitas adanya sweep menuju 0.799–0.787, lalu 0.775–0.757. Jika menembus di atas 0.853–0.859, sebaliknya akan mengekspos 0.865–0.871 dan kemudian 0.883–0.899.
#LiquidationMap
🔎 Peta likuidasi 7 hari menunjukkan perkiraan 9,5–10 juta USD dalam likuidasi long di bawah harga saat ini, melebihi sekitar 6–6,5 juta USD dalam likuidasi short di atas. Struktur likuiditas karenanya lebih menguntungkan sisi penurunan, dengan sekitar 1,5 kali lebih banyak likuiditas kumulatif di bawah pasar.
📉 Di bawah pasar, likuiditas likuidasi long terkonsentrasi kuat di kisaran 0.745–0.775. Klaster terkuat berada sekitar 0.757–0.769 dengan beberapa batang di dekat 0.35–0.60 juta USD, sementara konsentrasi paling padat berada di sekitar 0.762–0.768. Kehilangan 0.831 akan mengalihkan fokus ke 0.799–0.787, lalu 0.775–0.757.
📈 Di atas pasar, likuiditas likuidasi short terbagi dengan kuat di kisaran 0.853–0.899. Klaster yang menonjol muncul sekitar 0.857–0.871 dengan beberapa batang di dekat 0.20–0.31 juta USD, sedangkan 0.883–0.899 juga berisi beberapa kantong sekitar 0.20–0.25 juta USD.
🧭 Setup yang lebih luas lebih mendukung penurunan karena eksposur likuidasi long di bawah lebih besar. Kehilangan 0.831 akan meningkatkan probabilitas adanya sweep menuju 0.799–0.787, lalu 0.775–0.757. Jika menembus di atas 0.853–0.859, sebaliknya akan mengekspos 0.865–0.871 dan kemudian 0.883–0.899.
#LiquidationMap
149
·
--
Bullish
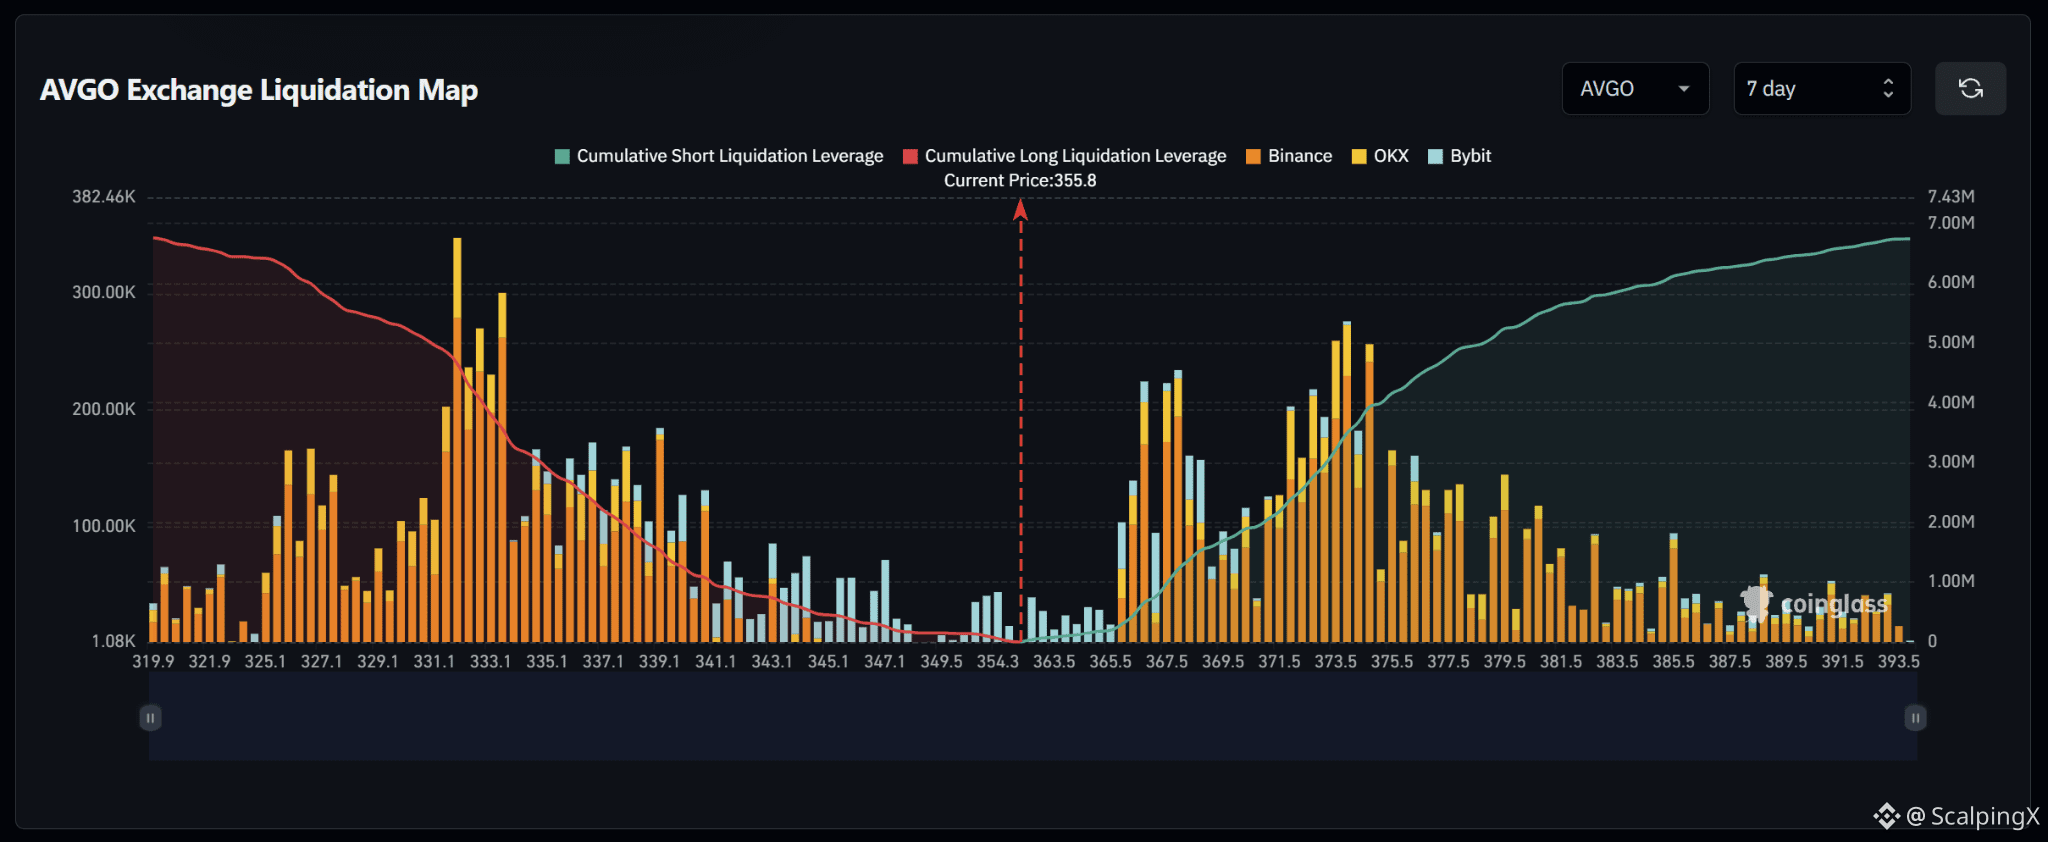
AVGO – Peta Likuidasi (7 Hari) – Harga Saat Ini 355.8
🔎 Peta likuidasi 7 hari ini relatif seimbang, dengan sekitar 6,6–6,8 juta USD pada likuidasi long di bawah harga saat ini dan sekitar 6,7–6,9 juta USD pada likuidasi short di atasnya. Eksposur likuidasi short sedikit lebih besar, sehingga struktur cenderung miring ke atas secara ringan, bukan ketidakseimbangan yang kuat.
📉 Di bawah pasar, likuiditas likuidasi long terkonsentrasi kuat di 331–339. Klaster terkuat berada di sekitar 332–334 dengan beberapa batang di kisaran 0,23–0,35 juta USD, sementara 326–328 dan 335–339 juga memuat beberapa kantong sekitar 0,14–0,18 juta USD. Jika 354 gagal/tembus turun, perhatian akan bergeser ke 349–345 lalu 339–333.
📈 Di atas pasar, likuiditas likuidasi short menjadi terkonsentrasi dari 366–375. Klaster terdekat yang terlihat berada di sekitar 366–368 dengan batang mendekati 0,21–0,23 juta USD, sedangkan area 372–375 yang lebih kuat berisi beberapa batang sekitar 0,20–0,27 juta USD. Lebih jauh lagi, 379–386 terus menahan likuiditas, meski menjadi lebih menyebar.
🧭 Pengaturan yang lebih luas ini mendekati seimbang, tetapi memiliki kecenderungan miring ke atas secara ringan. Tembus di atas 366–368 akan membuka 372–375, lalu 379–386. Jika 354 turun, justru akan meningkatkan probabilitas terjadinya sweep menuju 349–345 dan kemudian 339–333.
#LiquidationMap
AVGO – Peta Likuidasi (7 Hari) – Harga Saat Ini 355.8
🔎 Peta likuidasi 7 hari ini relatif seimbang, dengan sekitar 6,6–6,8 juta USD pada likuidasi long di bawah harga saat ini dan sekitar 6,7–6,9 juta USD pada likuidasi short di atasnya. Eksposur likuidasi short sedikit lebih besar, sehingga struktur cenderung miring ke atas secara ringan, bukan ketidakseimbangan yang kuat.
📉 Di bawah pasar, likuiditas likuidasi long terkonsentrasi kuat di 331–339. Klaster terkuat berada di sekitar 332–334 dengan beberapa batang di kisaran 0,23–0,35 juta USD, sementara 326–328 dan 335–339 juga memuat beberapa kantong sekitar 0,14–0,18 juta USD. Jika 354 gagal/tembus turun, perhatian akan bergeser ke 349–345 lalu 339–333.
📈 Di atas pasar, likuiditas likuidasi short menjadi terkonsentrasi dari 366–375. Klaster terdekat yang terlihat berada di sekitar 366–368 dengan batang mendekati 0,21–0,23 juta USD, sedangkan area 372–375 yang lebih kuat berisi beberapa batang sekitar 0,20–0,27 juta USD. Lebih jauh lagi, 379–386 terus menahan likuiditas, meski menjadi lebih menyebar.
🧭 Pengaturan yang lebih luas ini mendekati seimbang, tetapi memiliki kecenderungan miring ke atas secara ringan. Tembus di atas 366–368 akan membuka 372–375, lalu 379–386. Jika 354 turun, justru akan meningkatkan probabilitas terjadinya sweep menuju 349–345 dan kemudian 339–333.
#LiquidationMap
🔎 Peta likuidasi 7 hari ini relatif seimbang, dengan sekitar 6,6–6,8 juta USD pada likuidasi long di bawah harga saat ini dan sekitar 6,7–6,9 juta USD pada likuidasi short di atasnya. Eksposur likuidasi short sedikit lebih besar, sehingga struktur cenderung miring ke atas secara ringan, bukan ketidakseimbangan yang kuat.
📉 Di bawah pasar, likuiditas likuidasi long terkonsentrasi kuat di 331–339. Klaster terkuat berada di sekitar 332–334 dengan beberapa batang di kisaran 0,23–0,35 juta USD, sementara 326–328 dan 335–339 juga memuat beberapa kantong sekitar 0,14–0,18 juta USD. Jika 354 gagal/tembus turun, perhatian akan bergeser ke 349–345 lalu 339–333.
📈 Di atas pasar, likuiditas likuidasi short menjadi terkonsentrasi dari 366–375. Klaster terdekat yang terlihat berada di sekitar 366–368 dengan batang mendekati 0,21–0,23 juta USD, sedangkan area 372–375 yang lebih kuat berisi beberapa batang sekitar 0,20–0,27 juta USD. Lebih jauh lagi, 379–386 terus menahan likuiditas, meski menjadi lebih menyebar.
🧭 Pengaturan yang lebih luas ini mendekati seimbang, tetapi memiliki kecenderungan miring ke atas secara ringan. Tembus di atas 366–368 akan membuka 372–375, lalu 379–386. Jika 354 turun, justru akan meningkatkan probabilitas terjadinya sweep menuju 349–345 dan kemudian 339–333.
#LiquidationMap
1
95
·
--
Bullish
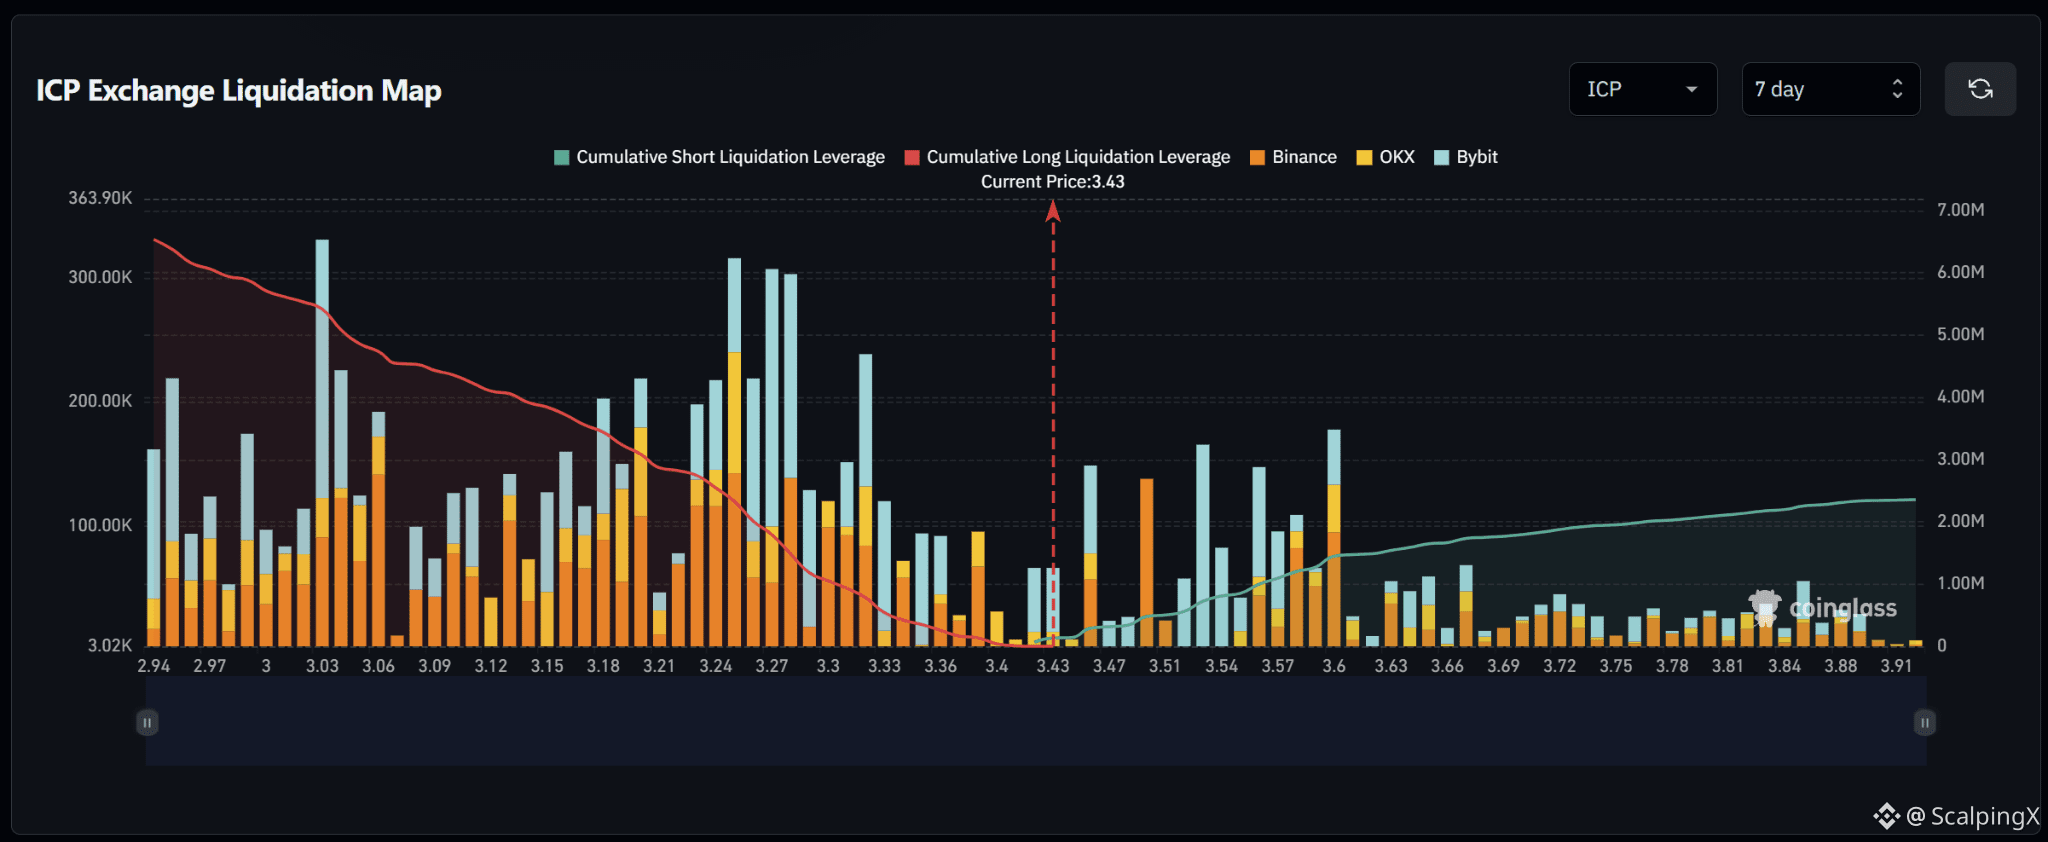
$ICP – Peta Likuidasi (7 Hari) – Harga Saat Ini 3.43
🔎 Peta likuidasi 7 hari menunjukkan sekitar 6,5 juta USD pada long liquidation di bawah harga saat ini, jelas melampaui sekitar 2,2 juta USD pada short liquidation di atasnya. Struktur likuiditas karenanya sangat menguntungkan sisi bawah, dengan hampir tiga kali lebih banyak likuiditas kumulatif di bawah pasar.
📉 Di bawah pasar, likuiditas long-liquidation terkonsentrasi kuat pada 3,18–3,33. Klaster terkuat berada di sekitar 3,24–3,28 dengan beberapa batang di kisaran 0,30–0,32 juta USD; 3,03 juga memuat sebuah batang di atas 0,3 juta USD, sementara 3,31–3,33 menampung klaster lain di sekitar 0,15–0,24 juta USD. Jika kehilangan 3,40, fokus akan bergeser ke 3,36–3,30 lalu 3,28–3,24.
📈 Di atas pasar, likuiditas short-liquidation jauh lebih tipis. Klaster yang menonjol muncul sekitar 3,46–3,47, 3,53–3,54, dan 3,58–3,60, dengan batang di kisaran 0,14–0,18 juta USD. Setelah 3,63, likuiditas menjadi semakin tipis dan lebih menyebar.
🧭 Setup yang lebih luas menguntungkan sisi bawah karena eksposur long-liquidation di bawah mendominasi. Kehilangan 3,40 akan meningkatkan probabilitas sweep menuju 3,36–3,30, kemudian 3,28–3,24. Menembus ke atas 3,47–3,54 justru akan mengekspos 3,58–3,60 sebelum harga memasuki zona likuiditas yang lebih tipis.
#LiquidationMap
$ICP – Peta Likuidasi (7 Hari) – Harga Saat Ini 3.43
🔎 Peta likuidasi 7 hari menunjukkan sekitar 6,5 juta USD pada long liquidation di bawah harga saat ini, jelas melampaui sekitar 2,2 juta USD pada short liquidation di atasnya. Struktur likuiditas karenanya sangat menguntungkan sisi bawah, dengan hampir tiga kali lebih banyak likuiditas kumulatif di bawah pasar.
📉 Di bawah pasar, likuiditas long-liquidation terkonsentrasi kuat pada 3,18–3,33. Klaster terkuat berada di sekitar 3,24–3,28 dengan beberapa batang di kisaran 0,30–0,32 juta USD; 3,03 juga memuat sebuah batang di atas 0,3 juta USD, sementara 3,31–3,33 menampung klaster lain di sekitar 0,15–0,24 juta USD. Jika kehilangan 3,40, fokus akan bergeser ke 3,36–3,30 lalu 3,28–3,24.
📈 Di atas pasar, likuiditas short-liquidation jauh lebih tipis. Klaster yang menonjol muncul sekitar 3,46–3,47, 3,53–3,54, dan 3,58–3,60, dengan batang di kisaran 0,14–0,18 juta USD. Setelah 3,63, likuiditas menjadi semakin tipis dan lebih menyebar.
🧭 Setup yang lebih luas menguntungkan sisi bawah karena eksposur long-liquidation di bawah mendominasi. Kehilangan 3,40 akan meningkatkan probabilitas sweep menuju 3,36–3,30, kemudian 3,28–3,24. Menembus ke atas 3,47–3,54 justru akan mengekspos 3,58–3,60 sebelum harga memasuki zona likuiditas yang lebih tipis.
#LiquidationMap
🔎 Peta likuidasi 7 hari menunjukkan sekitar 6,5 juta USD pada long liquidation di bawah harga saat ini, jelas melampaui sekitar 2,2 juta USD pada short liquidation di atasnya. Struktur likuiditas karenanya sangat menguntungkan sisi bawah, dengan hampir tiga kali lebih banyak likuiditas kumulatif di bawah pasar.
📉 Di bawah pasar, likuiditas long-liquidation terkonsentrasi kuat pada 3,18–3,33. Klaster terkuat berada di sekitar 3,24–3,28 dengan beberapa batang di kisaran 0,30–0,32 juta USD; 3,03 juga memuat sebuah batang di atas 0,3 juta USD, sementara 3,31–3,33 menampung klaster lain di sekitar 0,15–0,24 juta USD. Jika kehilangan 3,40, fokus akan bergeser ke 3,36–3,30 lalu 3,28–3,24.
📈 Di atas pasar, likuiditas short-liquidation jauh lebih tipis. Klaster yang menonjol muncul sekitar 3,46–3,47, 3,53–3,54, dan 3,58–3,60, dengan batang di kisaran 0,14–0,18 juta USD. Setelah 3,63, likuiditas menjadi semakin tipis dan lebih menyebar.
🧭 Setup yang lebih luas menguntungkan sisi bawah karena eksposur long-liquidation di bawah mendominasi. Kehilangan 3,40 akan meningkatkan probabilitas sweep menuju 3,36–3,30, kemudian 3,28–3,24. Menembus ke atas 3,47–3,54 justru akan mengekspos 3,58–3,60 sebelum harga memasuki zona likuiditas yang lebih tipis.
#LiquidationMap
1
14
·
--
Bullish
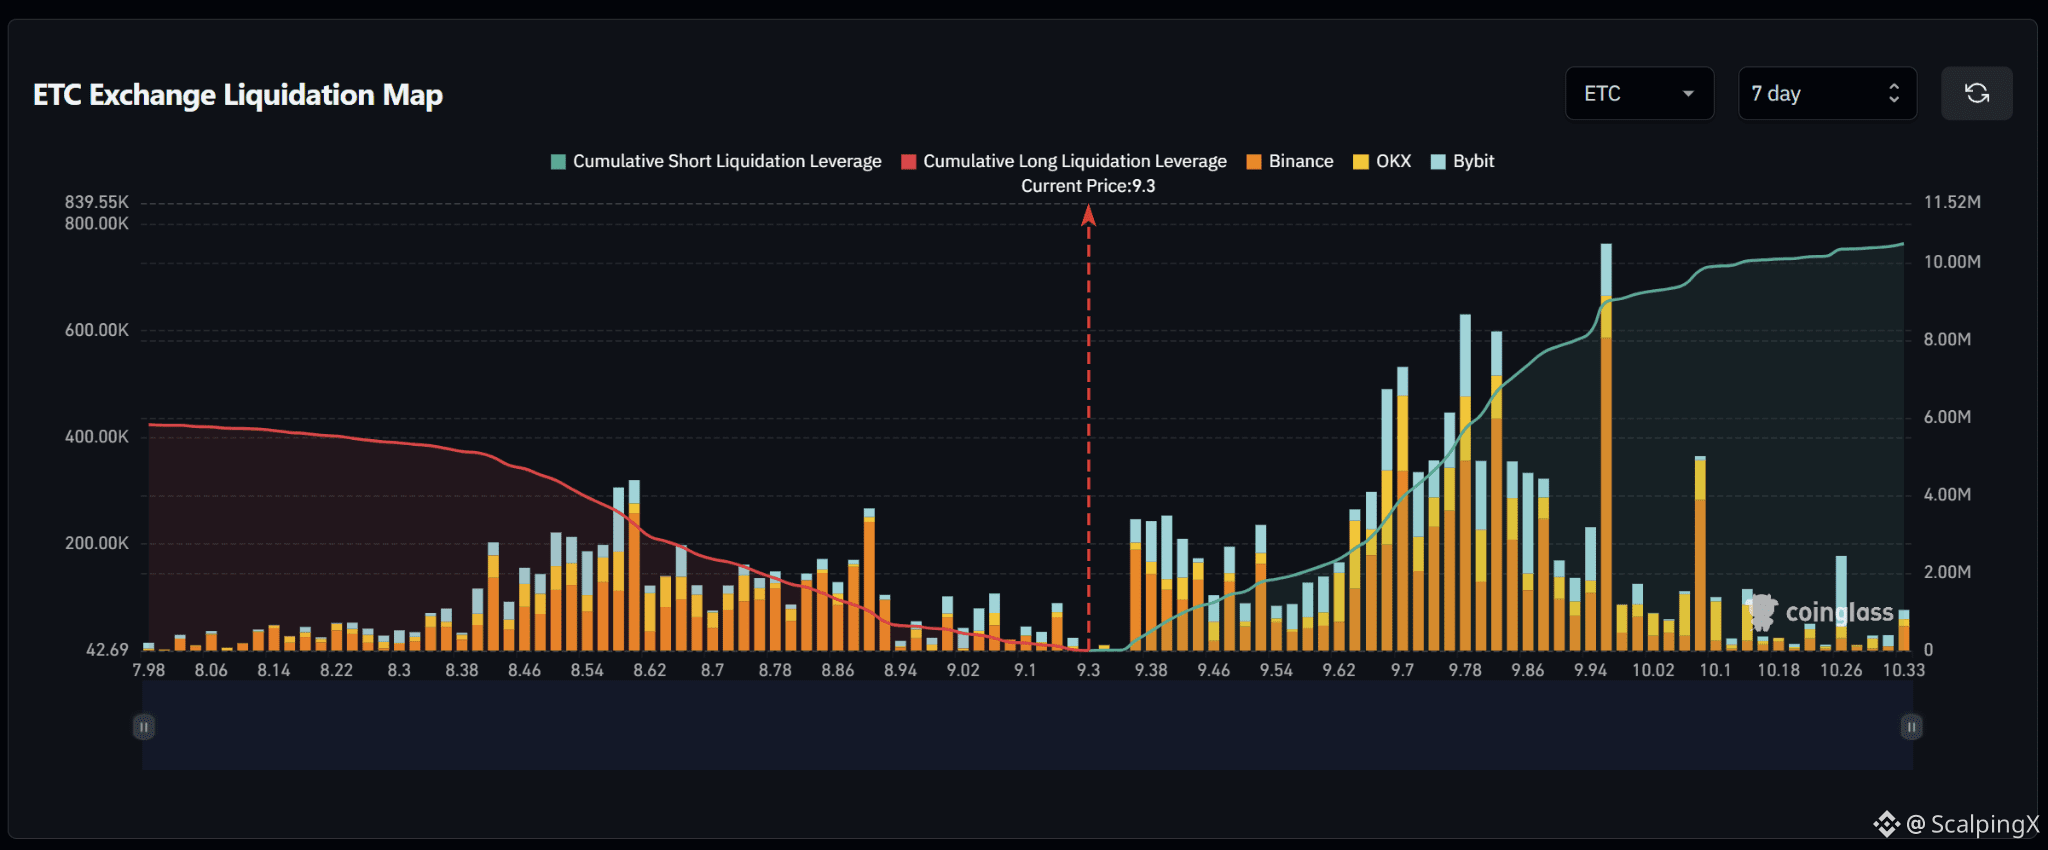
$ETC – Peta Likuidasi (7 Hari) – Harga Saat Ini 9.30
🔎 Peta likuidasi 7 hari menunjukkan kira-kira 10–11 juta USD dalam likuidasi short di atas harga saat ini, jauh melebihi sekitar 5,8–6 juta USD dalam likuidasi long di bawahnya. Struktur likuiditas karenanya jelas lebih menguntungkan sisi kenaikan, dengan sekitar 1,8 kali lebih banyak likuiditas kumulatif di atas pasar.
📉 Di bawah pasar, likuiditas likuidasi long terkonsentrasi terutama pada 8.42–8.66. Klaster penting berada di sekitar 8.46–8.62 dengan beberapa batang sekitar 0.15–0.32 juta USD, sementara 8.78–8.88 juga berisi beberapa kantong sekitar 0.15–0.25 juta USD. Jika gagal di 9.10 akan mengalihkan perhatian ke 9.02–8.94 lalu ke 8.86–8.62.
📈 Di atas pasar, likuiditas likuidasi short sangat terkonsentrasi pada 9.62–10.00. Klaster besar tampak sekitar 9.68–9.72 dengan satu batang di atas 0.5 juta USD, 9.78–9.84 dengan beberapa batang sekitar 0.35–0.63 juta USD, dan terutama 9.94–9.96 dengan satu batang mendekati 0.76 juta USD.
🧭 Pengaturan yang lebih luas mendukung sisi kenaikan karena paparan likuidasi short di atas mendominasi. Tembus di atas 9.54–9.62 akan membuka 9.68–9.84, kemudian klaster besar 9.94–9.96. Jika turun di bawah 9.10, justru akan meningkatkan probabilitas terjadinya sweep menuju 9.02–8.94 lalu 8.86–8.62.
#LiquidationMap
$ETC – Peta Likuidasi (7 Hari) – Harga Saat Ini 9.30
🔎 Peta likuidasi 7 hari menunjukkan kira-kira 10–11 juta USD dalam likuidasi short di atas harga saat ini, jauh melebihi sekitar 5,8–6 juta USD dalam likuidasi long di bawahnya. Struktur likuiditas karenanya jelas lebih menguntungkan sisi kenaikan, dengan sekitar 1,8 kali lebih banyak likuiditas kumulatif di atas pasar.
📉 Di bawah pasar, likuiditas likuidasi long terkonsentrasi terutama pada 8.42–8.66. Klaster penting berada di sekitar 8.46–8.62 dengan beberapa batang sekitar 0.15–0.32 juta USD, sementara 8.78–8.88 juga berisi beberapa kantong sekitar 0.15–0.25 juta USD. Jika gagal di 9.10 akan mengalihkan perhatian ke 9.02–8.94 lalu ke 8.86–8.62.
📈 Di atas pasar, likuiditas likuidasi short sangat terkonsentrasi pada 9.62–10.00. Klaster besar tampak sekitar 9.68–9.72 dengan satu batang di atas 0.5 juta USD, 9.78–9.84 dengan beberapa batang sekitar 0.35–0.63 juta USD, dan terutama 9.94–9.96 dengan satu batang mendekati 0.76 juta USD.
🧭 Pengaturan yang lebih luas mendukung sisi kenaikan karena paparan likuidasi short di atas mendominasi. Tembus di atas 9.54–9.62 akan membuka 9.68–9.84, kemudian klaster besar 9.94–9.96. Jika turun di bawah 9.10, justru akan meningkatkan probabilitas terjadinya sweep menuju 9.02–8.94 lalu 8.86–8.62.
#LiquidationMap
🔎 Peta likuidasi 7 hari menunjukkan kira-kira 10–11 juta USD dalam likuidasi short di atas harga saat ini, jauh melebihi sekitar 5,8–6 juta USD dalam likuidasi long di bawahnya. Struktur likuiditas karenanya jelas lebih menguntungkan sisi kenaikan, dengan sekitar 1,8 kali lebih banyak likuiditas kumulatif di atas pasar.
📉 Di bawah pasar, likuiditas likuidasi long terkonsentrasi terutama pada 8.42–8.66. Klaster penting berada di sekitar 8.46–8.62 dengan beberapa batang sekitar 0.15–0.32 juta USD, sementara 8.78–8.88 juga berisi beberapa kantong sekitar 0.15–0.25 juta USD. Jika gagal di 9.10 akan mengalihkan perhatian ke 9.02–8.94 lalu ke 8.86–8.62.
📈 Di atas pasar, likuiditas likuidasi short sangat terkonsentrasi pada 9.62–10.00. Klaster besar tampak sekitar 9.68–9.72 dengan satu batang di atas 0.5 juta USD, 9.78–9.84 dengan beberapa batang sekitar 0.35–0.63 juta USD, dan terutama 9.94–9.96 dengan satu batang mendekati 0.76 juta USD.
🧭 Pengaturan yang lebih luas mendukung sisi kenaikan karena paparan likuidasi short di atas mendominasi. Tembus di atas 9.54–9.62 akan membuka 9.68–9.84, kemudian klaster besar 9.94–9.96. Jika turun di bawah 9.10, justru akan meningkatkan probabilitas terjadinya sweep menuju 9.02–8.94 lalu 8.86–8.62.
#LiquidationMap
17

BTC/USDT — Analisis Likuiditas (24h)
Harga tetap terkonsolidasi dalam kisaran 84.000, terjepit di antara dua zona likuiditas yang relevan.
Zona yang menjadi perhatian:
Resistensi: ~85.000 – 85.500 (likuiditas padat di atas harga)
Dukungan: ~83.000 (akumulasi order di bawah)
Bacaan grafik:
Tidak ada pola grafik klasik (segitiga, kepala-dan-bahu) yang terbentuk dengan jelas. Yang terlihat adalah konsolidasi di antara zona likuiditas, perilaku yang umum sebelum menentukan arah.
Probabilitas (perkiraan):
Pengujian zona 85.000 sebelum arah yang jelas: tinggi (~65%)
Breakout yang bertahan di atas 85.500: moderat (~40%)
Kehilangan dukungan 83.000: rendah-menengah (~30%)
Kesimpulan:
Pasar cenderung "mencari" likuiditas yang terkumpul. Skenario yang paling mungkin adalah pengujian resistensi 85.000, dengan keputusan arah setelah pergerakan tersebut. Tunggu konfirmasi volume sebelum mengambil posisi.
⚠️ Analisis ini bersifat informatif, bukan rekomendasi investasi. Aset kripto bersifat volatil.
#liquidationmap #liquidez
BTC/USDT — Analisis Likuiditas (24h)
Harga tetap terkonsolidasi dalam kisaran 84.000, terjepit di antara dua zona likuiditas yang relevan.
Zona yang menjadi perhatian:
Resistensi: ~85.000 – 85.500 (likuiditas padat di atas harga)
Dukungan: ~83.000 (akumulasi order di bawah)
Bacaan grafik:
Tidak ada pola grafik klasik (segitiga, kepala-dan-bahu) yang terbentuk dengan jelas. Yang terlihat adalah konsolidasi di antara zona likuiditas, perilaku yang umum sebelum menentukan arah.
Probabilitas (perkiraan):
Pengujian zona 85.000 sebelum arah yang jelas: tinggi (~65%)
Breakout yang bertahan di atas 85.500: moderat (~40%)
Kehilangan dukungan 83.000: rendah-menengah (~30%)
Kesimpulan:
Pasar cenderung "mencari" likuiditas yang terkumpul. Skenario yang paling mungkin adalah pengujian resistensi 85.000, dengan keputusan arah setelah pergerakan tersebut. Tunggu konfirmasi volume sebelum mengambil posisi.
⚠️ Analisis ini bersifat informatif, bukan rekomendasi investasi. Aset kripto bersifat volatil.
#liquidationmap #liquidez
Harga tetap terkonsolidasi dalam kisaran 84.000, terjepit di antara dua zona likuiditas yang relevan.
Zona yang menjadi perhatian:
Resistensi: ~85.000 – 85.500 (likuiditas padat di atas harga)
Dukungan: ~83.000 (akumulasi order di bawah)
Bacaan grafik:
Tidak ada pola grafik klasik (segitiga, kepala-dan-bahu) yang terbentuk dengan jelas. Yang terlihat adalah konsolidasi di antara zona likuiditas, perilaku yang umum sebelum menentukan arah.
Probabilitas (perkiraan):
Pengujian zona 85.000 sebelum arah yang jelas: tinggi (~65%)
Breakout yang bertahan di atas 85.500: moderat (~40%)
Kehilangan dukungan 83.000: rendah-menengah (~30%)
Kesimpulan:
Pasar cenderung "mencari" likuiditas yang terkumpul. Skenario yang paling mungkin adalah pengujian resistensi 85.000, dengan keputusan arah setelah pergerakan tersebut. Tunggu konfirmasi volume sebelum mengambil posisi.
⚠️ Analisis ini bersifat informatif, bukan rekomendasi investasi. Aset kripto bersifat volatil.
#liquidationmap #liquidez
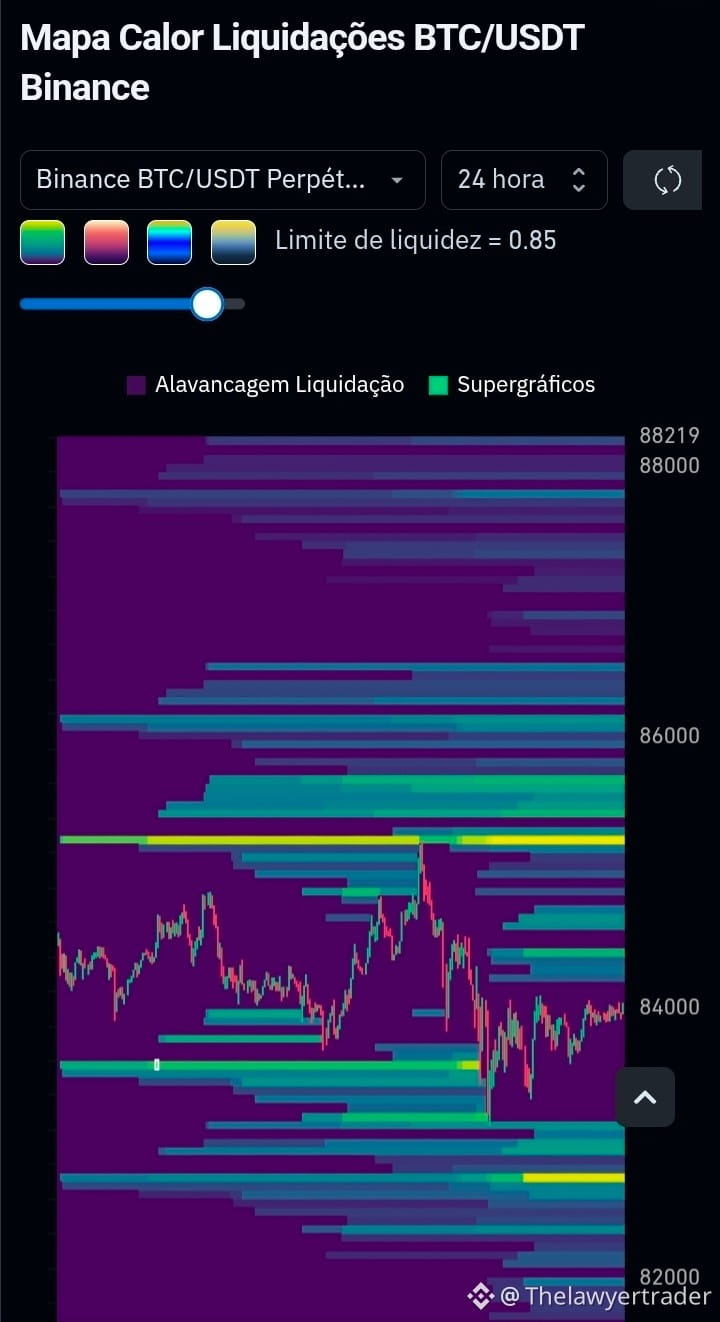
2
250
Masuk untuk menjelajahi konten lainnya
Bergabunglah dengan pengguna kripto global di Binance Square
⚡️ Dapatkan informasi terbaru dan berguna tentang kripto.
💬 Dipercayai oleh bursa kripto terbesar di dunia.
👍 Temukan wawasan nyata dari kreator terverifikasi.
Email/Nomor Ponsel
Topik Sedang Tren
1
#BinanceLaunchesBinanceIntelligence
751,364 penayangan
4,672 Berdiskusi
2
#BTCFallsBelow$84K
33,981 penayangan
115 Berdiskusi
3
#DubaiVARAIssuesReserveAssetAuditCircular
9,690 penayangan
378 Berdiskusi
4
#SECApproves3XBitcoinETF
8,872 penayangan
321 Berdiskusi
5
#WinklevossFilesSpotZcashETFApplication
18,673 penayangan
438 Berdiskusi
6
#SouthKoreaAITradeLiftsWorldcoinTo$7.41B
2,232 penayangan
39 Berdiskusi
7
#StrategyEstimates$4.1BIncomeTaxBenefit
1,454 penayangan
22 Berdiskusi
8
#IglooShutsDownAbstractBlockchain
7,561 penayangan
228 Berdiskusi
9
#StrategyMarketCapSurpassesRumble
48,468 penayangan
952 Berdiskusi
10
#StriveBuys2000BTCFor$169M
18,788 penayangan
163 Berdiskusi