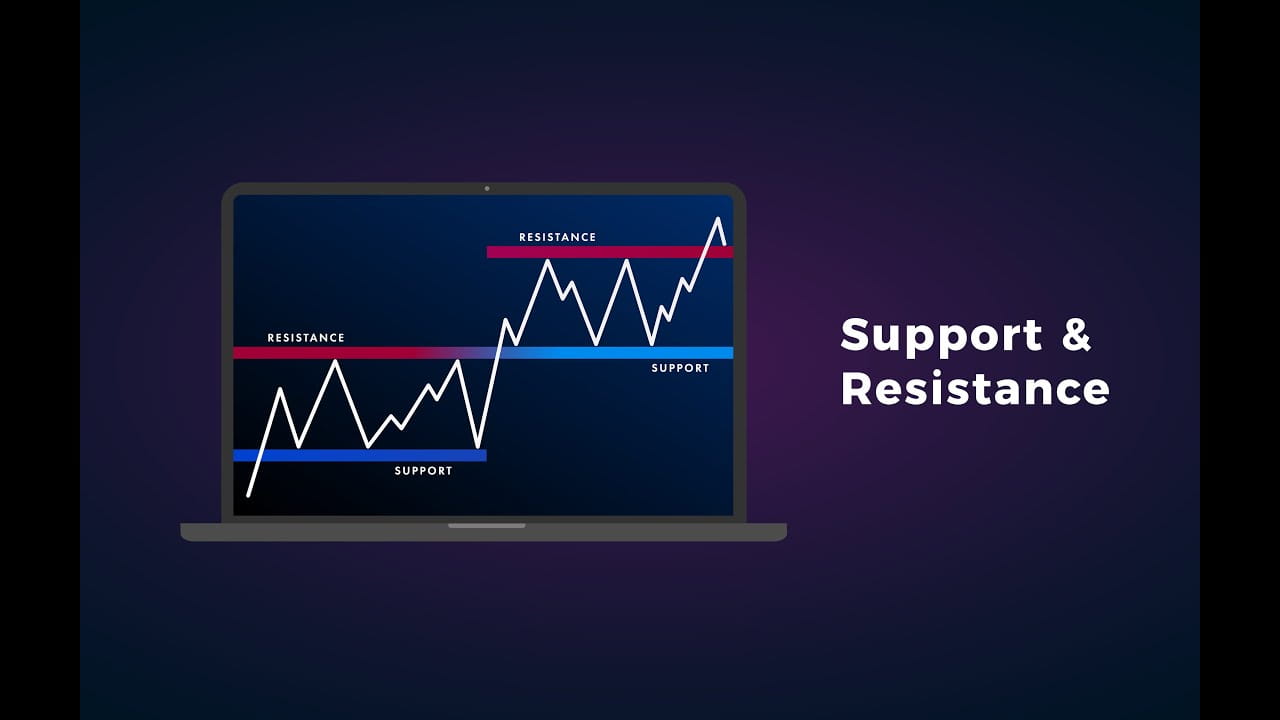
Support and resistance are two of the most commonly used terms in technical analysis, which is the study of past market data to predict future market behavior. Support refers to a price level that a stock or other asset has difficulty falling below, while resistance refers to a price level that a stock or other asset has difficulty rising above. These price levels are based on historical patterns and can provide traders with valuable information about where to enter or exit trades.
Support Levels
A support level is a price level that a stock or other asset has difficulty falling below. It is typically represented by a horizontal line on a price chart, and it is often used as a key indicator of the strength of a stock or other asset. If the price of a stock or other asset approaches a support level and then bounces back up, this is seen as a sign that there is significant buying interest at that level.
Support levels are typically established as a result of previous market behavior. For example, if a stock has consistently bounced back up after falling to a certain price level, that level may be identified as a support level. The more times the price bounces back up from a particular level, the stronger the support level is considered to be.
There are several different types of support levels. The most common type is a horizontal support level, which is a flat line that represents a price level where buying pressure is expected to emerge. Another type of support level is a trendline, which is a line that is drawn between the low points of an upward trend. This line can also act as a support level, as buyers may be willing to step in and buy the stock or other asset at this level.
Resistance Levels
Resistance levels are the opposite of support levels. They are price levels that a stock or other asset has difficulty rising above. Resistance levels are also represented by horizontal lines on a price chart, and they are often used as a key indicator of the strength of a stock or other asset. If the price of a stock or other asset approaches a resistance level and then falls back down, this is seen as a sign that there is significant selling pressure at that level.
Resistance levels are typically established as a result of previous market behavior. For example, if a stock has consistently fallen back after rising to a certain price level, that level may be identified as a resistance level. The more times the price falls back from a particular level, the stronger the resistance level is considered to be.
There are several different types of resistance levels. The most common type is a horizontal resistance level, which is a flat line that represents a price level where selling pressure is expected to emerge. Another type of resistance level is a trendline, which is a line that is drawn between the high points of a downward trend. This line can also act as a resistance level, as sellers may be willing to step in and sell the stock or other asset at this level.
Using Support and Resistance in Trading
Traders use support and resistance levels to identify potential buy and sell signals. For example, if a trader sees that a stock has bounced back up from a particular support level several times, they may decide to buy the stock when it reaches that level again, as there is a good chance that it will bounce back up again. Similarly, if a trader sees that a stock has consistently fallen back from a particular resistance level, they may decide to sell the stock when it reaches that level again, as there is a good chance that it will fall back down again.
Traders also use support and resistance levels to set stop-loss orders. A stop-loss order is an order to sell a stock or other asset if it falls below a certain price level. By setting a stop-loss order just below a support level, traders can limit their potential losses if the stock falls below that level.