$BNB Alert! Is this local dip to $500 the ultimate shakeout before a massive rebound? 🚨
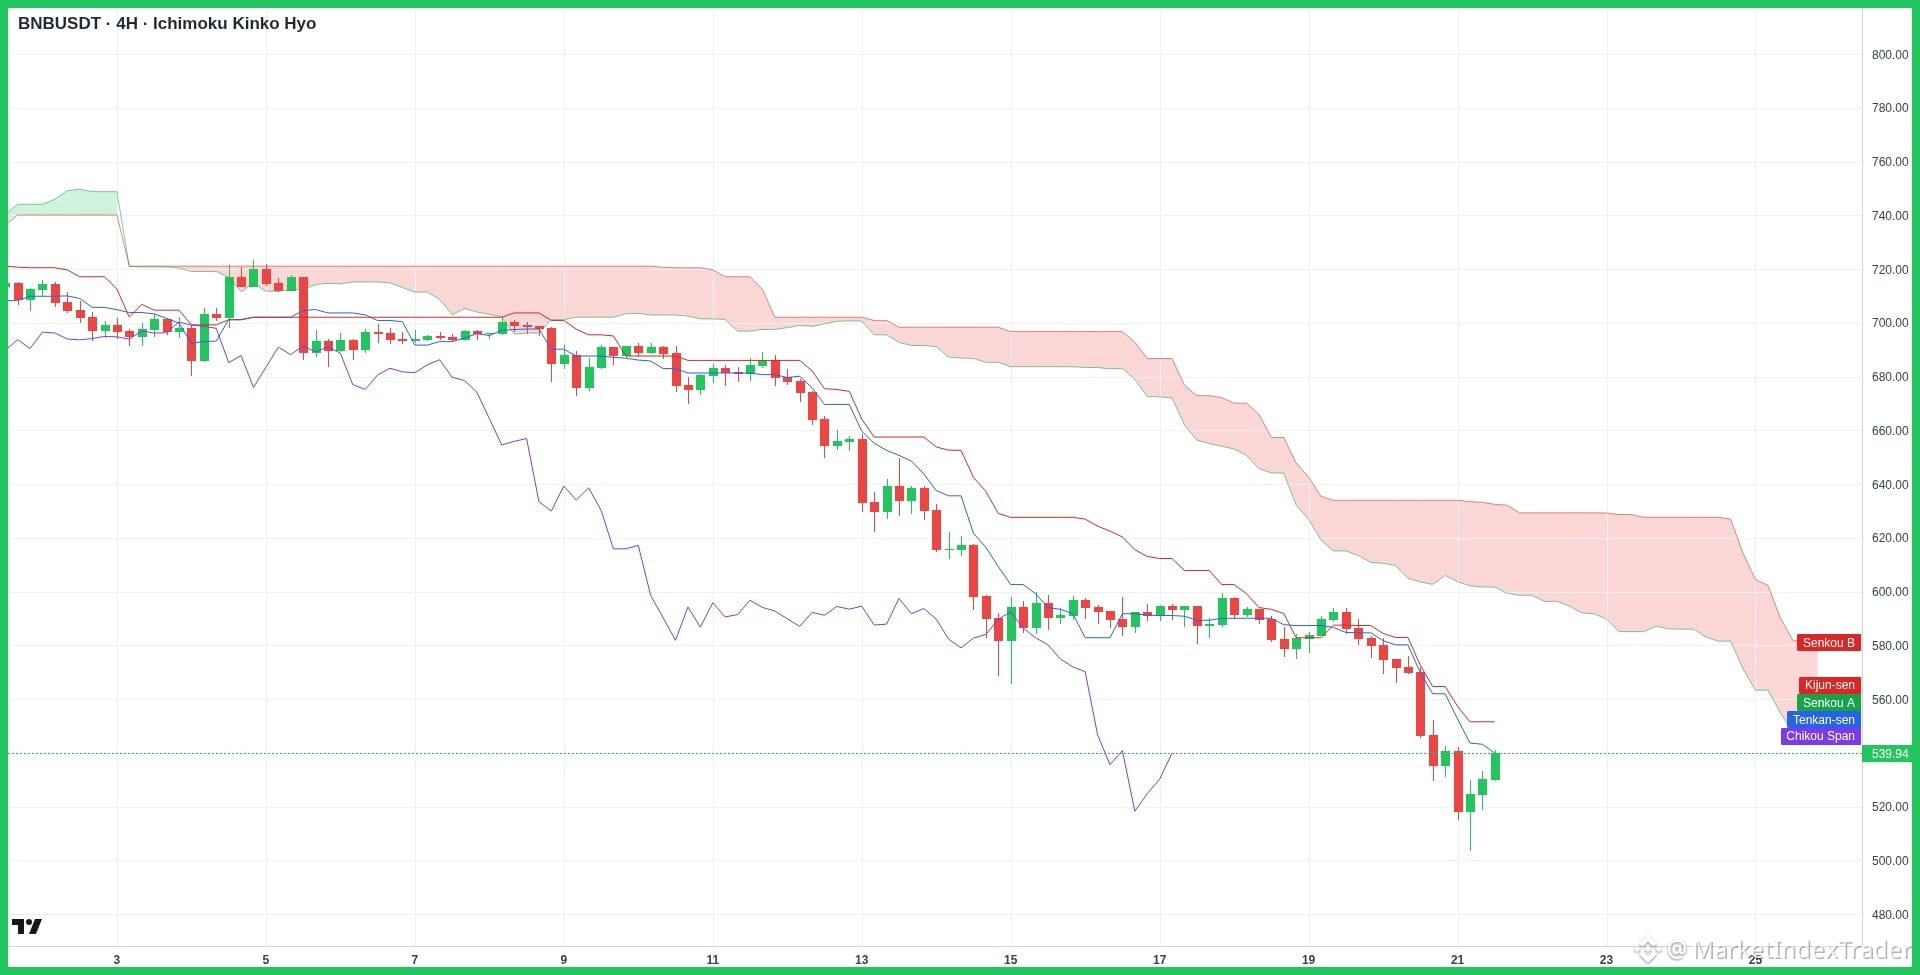
$BNB's 4H chart shows price rebounding off the $500 support zone while attempting to break above the $550-$560 Ichimoku resistance level.
Alright team, let's break down this juicy $BNB chart and see what's cooking after the recent market shakeout!
Technical Analysis:
Looking at the 4-hour Ichimoku chart, $BNB took a sharp dip down to test the major support zone around $500 - $520. Buyers quickly stepped in, creating a solid lower-wick reversal. Currently trading near $540, $BNB faces immediate resistance at the Tenkan-sen and Kijun-sen lines between $550 and $560. A successful breakout above this zone could ignite a strong recovery move towards the main Kumo Cloud resistance at $580 - $600.
Fundamental Analysis:
On the fundamental side, BNB continues to maintain massive ecosystem momentum driven by high utility via Binance Launchpool and Megadrop initiatives. Additionally, the regular quarterly BNB auto-burn continuously reduces total supply, providing powerful deflationary tailwinds for long-term holders.
Action Plan:
This dip into the $500–$520 region presents an attractive zone for DCA (Dollar-Cost Averaging). Watching for a clean 4H close above $560 to confirm bullish continuation toward $600+.
Highly recommend HOLD and Stacking $BNB at Binance
Feel free to comment the altcoin you are holding and we will check it for you!
BNB #TechnicalAnalysis #Crypto #BinanceSquare #Bitcoin
$BNB's 4H chart shows price rebounding off the $500 support zone while attempting to break above the $550-$560 Ichimoku resistance level.
Alright team, let's break down this juicy $BNB chart and see what's cooking after the recent market shakeout!
Technical Analysis:
Looking at the 4-hour Ichimoku chart, $BNB took a sharp dip down to test the major support zone around $500 - $520. Buyers quickly stepped in, creating a solid lower-wick reversal. Currently trading near $540, $BNB faces immediate resistance at the Tenkan-sen and Kijun-sen lines between $550 and $560. A successful breakout above this zone could ignite a strong recovery move towards the main Kumo Cloud resistance at $580 - $600.
Fundamental Analysis:
On the fundamental side, BNB continues to maintain massive ecosystem momentum driven by high utility via Binance Launchpool and Megadrop initiatives. Additionally, the regular quarterly BNB auto-burn continuously reduces total supply, providing powerful deflationary tailwinds for long-term holders.
Action Plan:
This dip into the $500–$520 region presents an attractive zone for DCA (Dollar-Cost Averaging). Watching for a clean 4H close above $560 to confirm bullish continuation toward $600+.
Highly recommend HOLD and Stacking $BNB at Binance
Feel free to comment the altcoin you are holding and we will check it for you!
BNB #TechnicalAnalysis #Crypto #BinanceSquare #Bitcoin