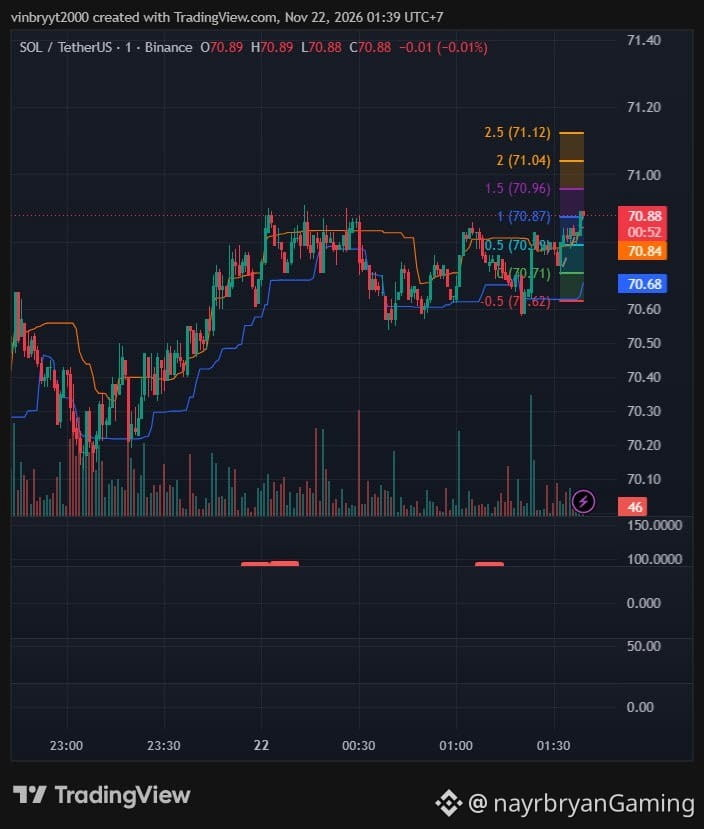
LIGHT ANALYSIS / CHART SETUP — SOL/USDT
📈 STRUCTURE OVERVIEW
Market phase:
Recovery → Mid-range consolidation → Awaiting break
Current price: 70.88
Immediate resistance: 70.96 – 71.04
Major resistance: 71.12
Key support: 70.71 → 70.62
📌 WHAT I’M WATCHING
Scenario A — Bullish Breakout
If SOL breaks and holds above 70.96, price may rotate toward:
71.04 → 71.12
Scenario B — Bearish Breakdown
If SOL loses 70.71 and the blue line, the next level to monitor is 70.62.
A break below 70.62 would weaken the current higher-low structure.
📊 INDICATOR CHECK
Blue line: Acting as short-term support
Orange line: Acting as short-term resistance
Price structure: Consolidating between 0.5 and 1.5 Fib
Bullish confirmation: Break above 70.96
Bearish confirmation: Loss of 70.71
Note: This is a chart framework, not a trade recommendation. One-minute candles are highly sensitive to short-term volatility.
— @nayrbryanGaming
#SOLAnalysis #ChartSetup #PriceAction #Fibonacci #CryptoTrading #DYOR #NFA
📈 STRUCTURE OVERVIEW
Market phase:
Recovery → Mid-range consolidation → Awaiting break
Current price: 70.88
Immediate resistance: 70.96 – 71.04
Major resistance: 71.12
Key support: 70.71 → 70.62
📌 WHAT I’M WATCHING
Scenario A — Bullish Breakout
If SOL breaks and holds above 70.96, price may rotate toward:
71.04 → 71.12
Scenario B — Bearish Breakdown
If SOL loses 70.71 and the blue line, the next level to monitor is 70.62.
A break below 70.62 would weaken the current higher-low structure.
📊 INDICATOR CHECK
Blue line: Acting as short-term support
Orange line: Acting as short-term resistance
Price structure: Consolidating between 0.5 and 1.5 Fib
Bullish confirmation: Break above 70.96
Bearish confirmation: Loss of 70.71
Note: This is a chart framework, not a trade recommendation. One-minute candles are highly sensitive to short-term volatility.
— @nayrbryanGaming
#SOLAnalysis #ChartSetup #PriceAction #Fibonacci #CryptoTrading #DYOR #NFA