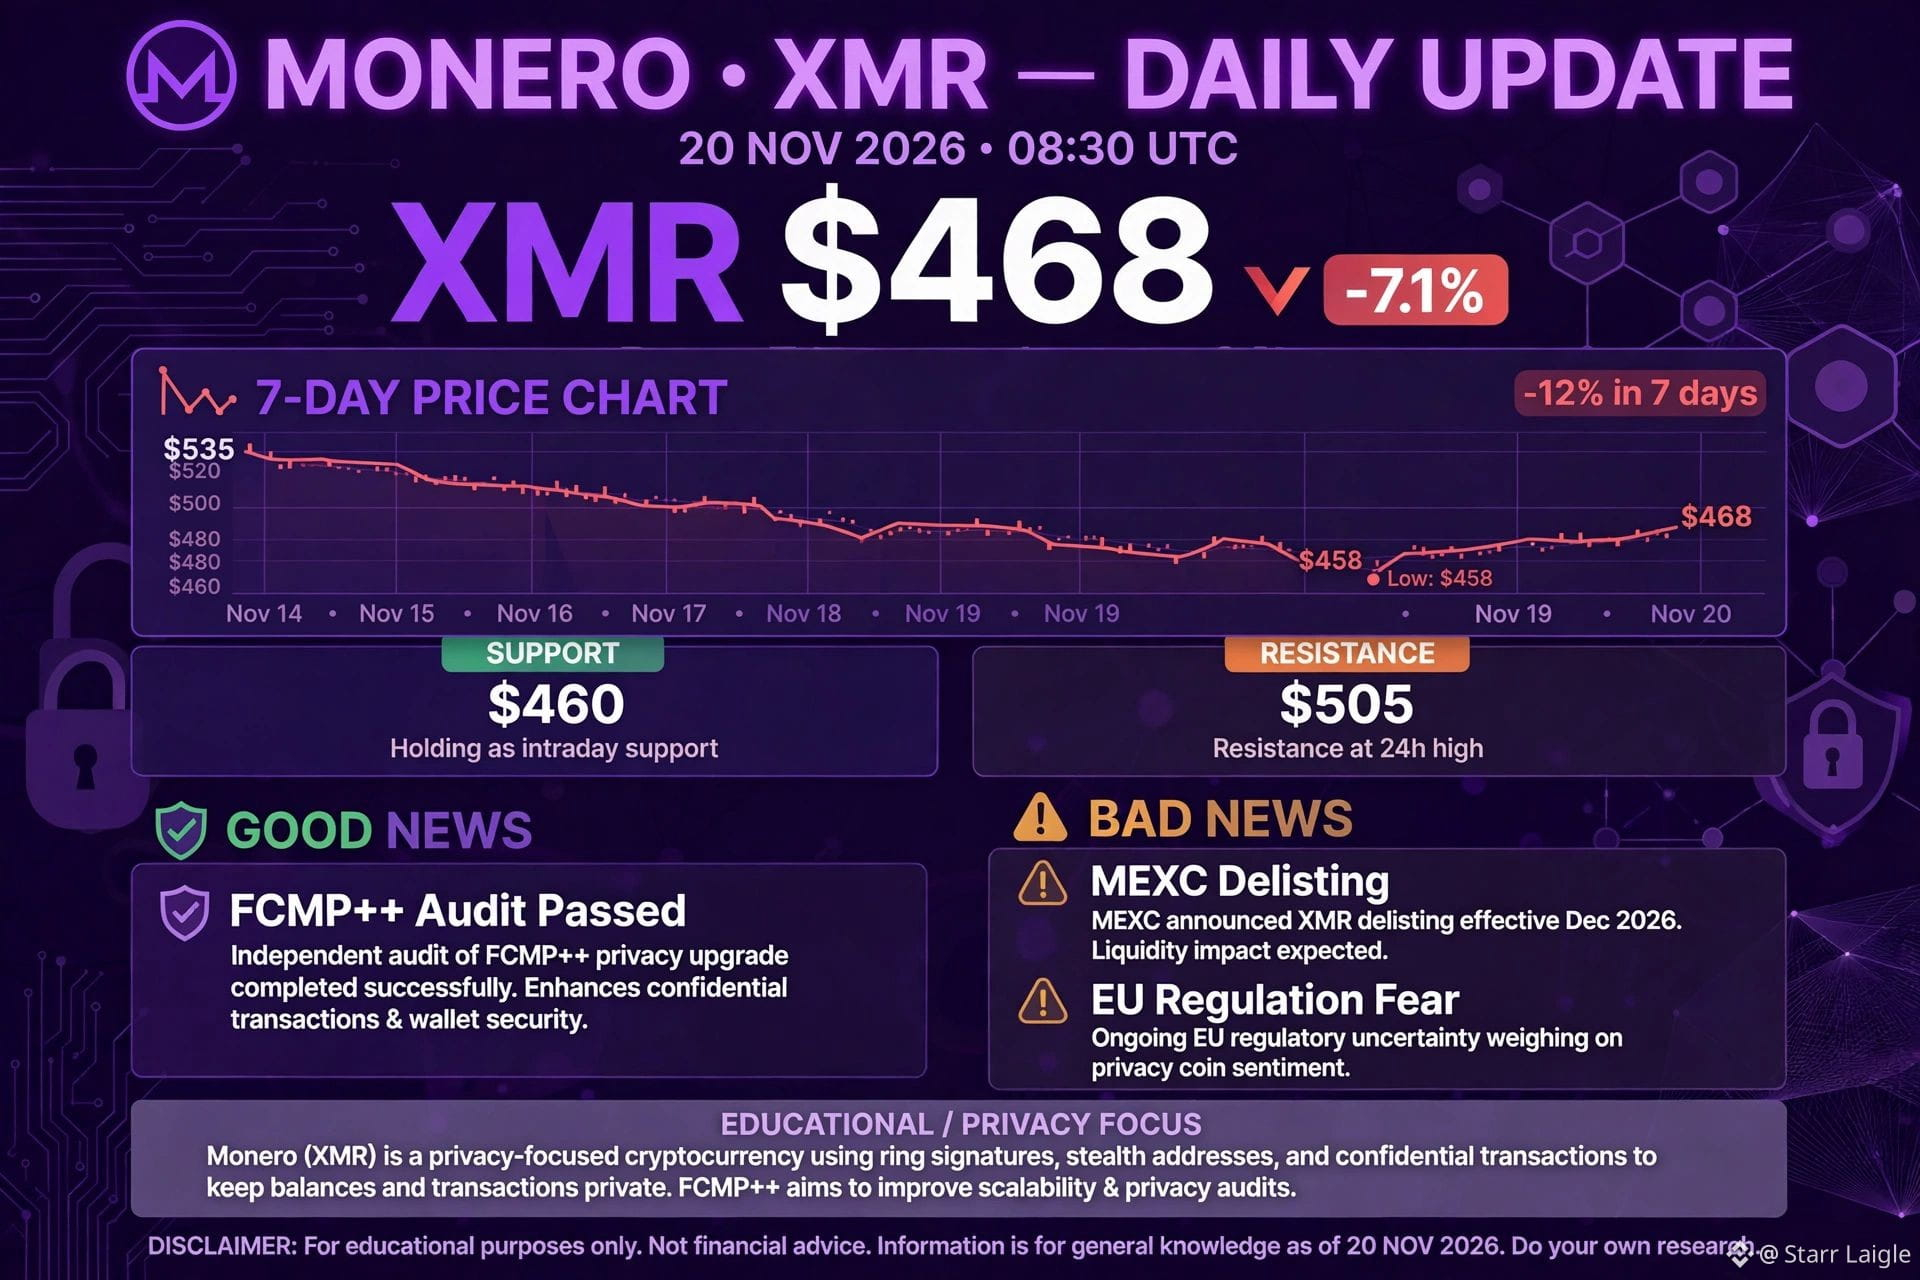
*📉 $XMR 7-DAY CHART BREAKDOWN - 20 NOV 2026*
You asked for the chart, here is the full story behind it. Read this before you buy or sell $XMR .
*7-DAY PRICE JOURNEY:*
- *14 Nov: $535* - Starting point. $XMR was already falling from $640 high on 4 Nov.
- *15 Nov: $520* - Slow bleed. Market fear rising.
- *16 Nov: $505* - Broke $500 psychological level. Panic started.
- *17 Nov: $490* - MEXC delisting news hit hard. Sellers increased.
- *18 Nov: $480* - FCMP++ audit passed news came, but market ignored good news. That's bear market sign - good news doesn't pump.
- *19 Nov: $465* - Touching support. Volume spiked.
*WHAT DOES CHART TELL US?*
*1. Downtrend is CLEAN*
Chart is not going up-down-up-down. It's going down-down-down with small bounces. Every bounce is getting sold. This is called Lower Highs. 14 Nov high $535, 16 Nov high $505, 18 Nov high $480, 20 Nov high $468. Each high is LOWER than previous. Sellers are in control.
*2. $458 is KEY LOW*
On 20 Nov, XMR touched $458 and bounced to $468. That $458 is now the line. If XMR goes below $458 again, next target is $440, then $420. If XMR stays above $458, we can see bounce to $490-$505.
*3. Volume is HIGH on DOWN days, LOW on UP days*
That means sellers are strong, buyers are weak. When XMR falls, many people sell.
*4. Good News Didn't Work*
18 Nov - FCMP++ audit passed. This is HUGE technology news. In bull market, XMR would pump 20% on this news.
*5. MEXC Delisting is Still in Price*
People are still selling because they fear more exchanges will delist XMR.
*WHAT TO DO NOW?*
*If You Are Holding XMR:*
Don't panic sell at $468. You are already down 28% from top.
*If You Want To Buy XMR:*
Don't buy all at $468. Buy in parts:
- 25% at $468 (now)
- 25% at $440 (if it falls)
- 25% at $420 (if it crashes)
- Keep 25% cash for $400 zone
This is called DCA - Dollar Cost Averaging. This way your average price will be $450-$460, not $468.
#XMRUSD #XMRUSD #xmr👀 #XMRUpdate #XMRDelisting
You asked for the chart, here is the full story behind it. Read this before you buy or sell $XMR .
*7-DAY PRICE JOURNEY:*
- *14 Nov: $535* - Starting point. $XMR was already falling from $640 high on 4 Nov.
- *15 Nov: $520* - Slow bleed. Market fear rising.
- *16 Nov: $505* - Broke $500 psychological level. Panic started.
- *17 Nov: $490* - MEXC delisting news hit hard. Sellers increased.
- *18 Nov: $480* - FCMP++ audit passed news came, but market ignored good news. That's bear market sign - good news doesn't pump.
- *19 Nov: $465* - Touching support. Volume spiked.
*WHAT DOES CHART TELL US?*
*1. Downtrend is CLEAN*
Chart is not going up-down-up-down. It's going down-down-down with small bounces. Every bounce is getting sold. This is called Lower Highs. 14 Nov high $535, 16 Nov high $505, 18 Nov high $480, 20 Nov high $468. Each high is LOWER than previous. Sellers are in control.
*2. $458 is KEY LOW*
On 20 Nov, XMR touched $458 and bounced to $468. That $458 is now the line. If XMR goes below $458 again, next target is $440, then $420. If XMR stays above $458, we can see bounce to $490-$505.
*3. Volume is HIGH on DOWN days, LOW on UP days*
That means sellers are strong, buyers are weak. When XMR falls, many people sell.
*4. Good News Didn't Work*
18 Nov - FCMP++ audit passed. This is HUGE technology news. In bull market, XMR would pump 20% on this news.
*5. MEXC Delisting is Still in Price*
People are still selling because they fear more exchanges will delist XMR.
*WHAT TO DO NOW?*
*If You Are Holding XMR:*
Don't panic sell at $468. You are already down 28% from top.
*If You Want To Buy XMR:*
Don't buy all at $468. Buy in parts:
- 25% at $468 (now)
- 25% at $440 (if it falls)
- 25% at $420 (if it crashes)
- Keep 25% cash for $400 zone
This is called DCA - Dollar Cost Averaging. This way your average price will be $450-$460, not $468.
#XMRUSD #XMRUSD #xmr👀 #XMRUpdate #XMRDelisting