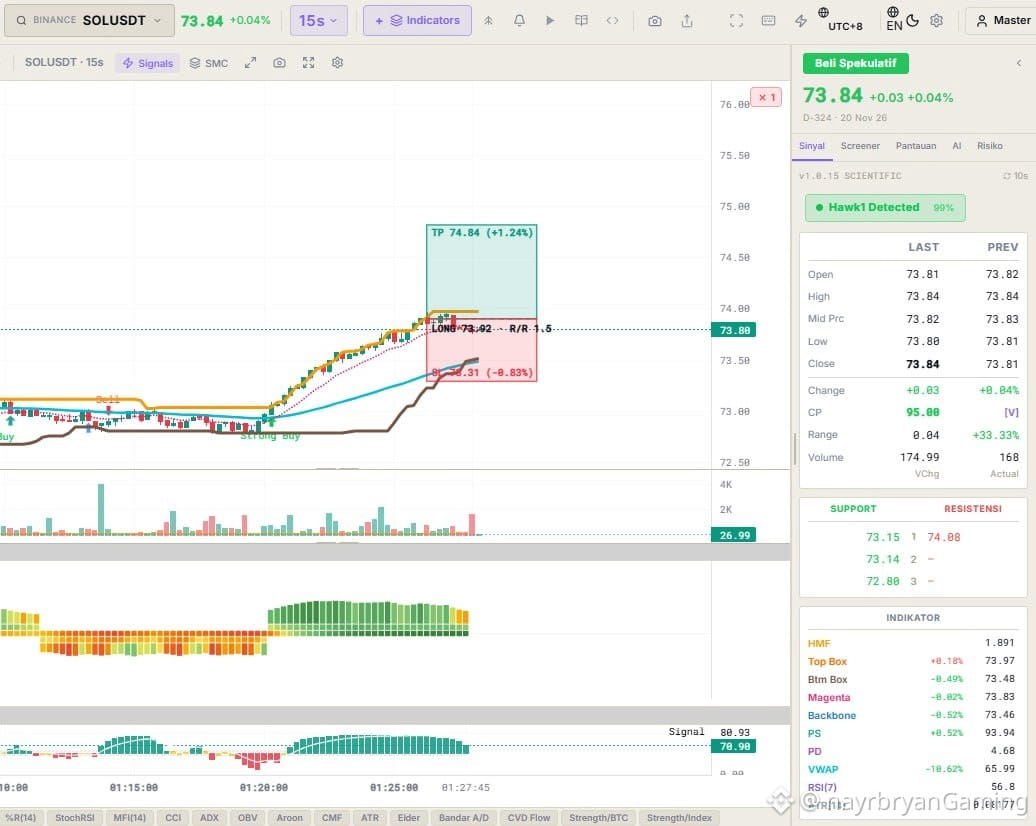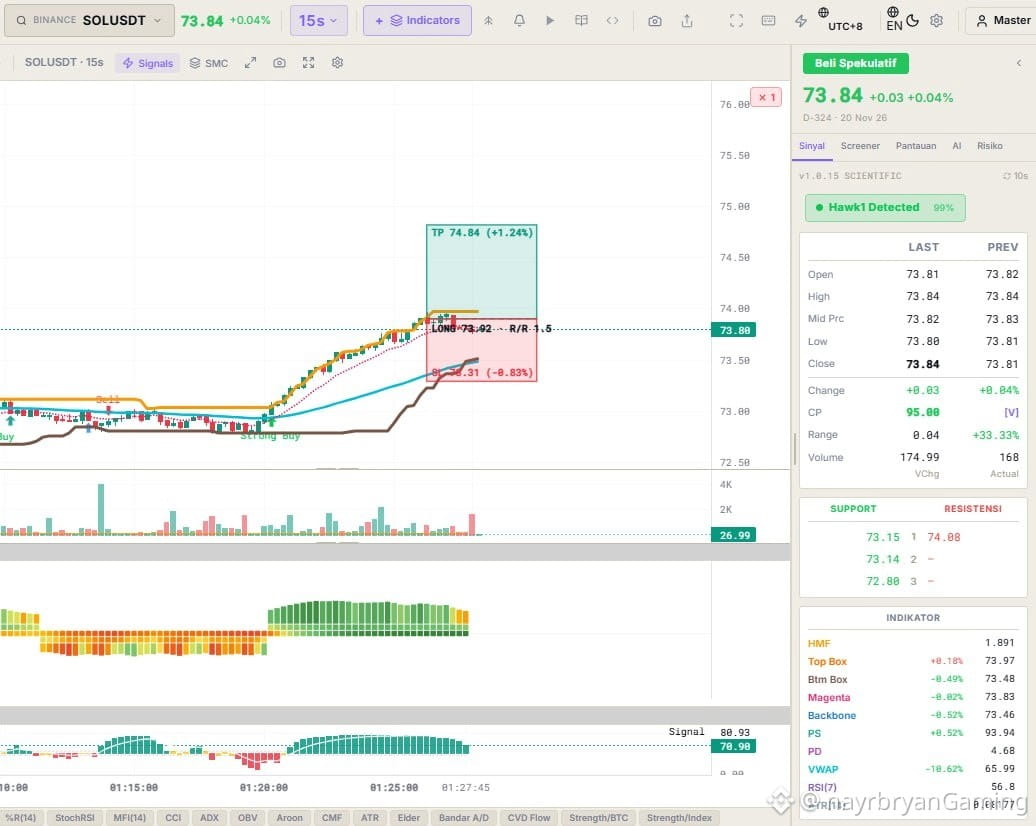
LIGHT ANALYSIS / CHART SETUP — SOL/USDT
📈 STRUCTURE OVERVIEW
Market Phase:
Recovery → Bullish Momentum → Consolidation → Potential Continuation
Current Price:
73.84
LONG Entry Reference:
73.92
Immediate Resistance:
74.08
Support References:
73.15–73.14
Additional Support:
72.88
Take-Profit:
74.84
Stop-Loss:
73.31
Risk/Reward:
1:1.5
---
📌 WHAT I'M WATCHING
SCENARIO A — BULLISH CONTINUATION
If SOL reclaims 73.92 and establishes sustained buying momentum, the next important reference is:
74.08 → 74.84.
Watch for:
• Strong bullish candle confirmation.
• Sustained price action above 73.92.
• Improving buying momentum.
• Continuation above nearby resistance.
• Increasing volume during the upward movement.
SCENARIO B — FAILED RECOVERY
If SOL fails to maintain its bullish recovery, the immediate LONG setup could weaken.
The predefined invalidation level is:
73.31.
Additional chart support references:
73.15 → 73.14 → 72.88.
A move toward the stop-loss invalidates the illustrated setup.
---
📊 INDICATOR CHECK
Hawk1:
Detected 99% (as displayed by the indicator panel).
Resistance:
74.08.
Support:
73.15 / 73.14 / 72.88.
RSI(7):
56.8.
ATR(14):
0.08177.
Price Structure:
Short-term bullish recovery.
Entry:
73.92.
TP:
74.84.
SL:
73.31.
Risk/Reward:
1:1.5.
---
📝 CHART NOTE
SOL is showing improving short-term momentum, but the current price remains slightly below the illustrated LONG entry.
The important confirmation is whether buyers can reclaim 73.92 and sustain the upward movement.
Avoid treating an indicator signal or a single bullish candle as guaranteed continuation.
This is an educational chart framework, not a trade recommendation.
— @nayrbryanGaming
#SOLAnalysis #ChartSetup #PriceAction #TechnicalAnalysis #CryptoTrading #TradingIndicators #RiskManagement #DYOR #NFA
━━━━━━━━━━━
📈 STRUCTURE OVERVIEW
Market Phase:
Recovery → Bullish Momentum → Consolidation → Potential Continuation
Current Price:
73.84
LONG Entry Reference:
73.92
Immediate Resistance:
74.08
Support References:
73.15–73.14
Additional Support:
72.88
Take-Profit:
74.84
Stop-Loss:
73.31
Risk/Reward:
1:1.5
---
📌 WHAT I'M WATCHING
SCENARIO A — BULLISH CONTINUATION
If SOL reclaims 73.92 and establishes sustained buying momentum, the next important reference is:
74.08 → 74.84.
Watch for:
• Strong bullish candle confirmation.
• Sustained price action above 73.92.
• Improving buying momentum.
• Continuation above nearby resistance.
• Increasing volume during the upward movement.
SCENARIO B — FAILED RECOVERY
If SOL fails to maintain its bullish recovery, the immediate LONG setup could weaken.
The predefined invalidation level is:
73.31.
Additional chart support references:
73.15 → 73.14 → 72.88.
A move toward the stop-loss invalidates the illustrated setup.
---
📊 INDICATOR CHECK
Hawk1:
Detected 99% (as displayed by the indicator panel).
Resistance:
74.08.
Support:
73.15 / 73.14 / 72.88.
RSI(7):
56.8.
ATR(14):
0.08177.
Price Structure:
Short-term bullish recovery.
Entry:
73.92.
TP:
74.84.
SL:
73.31.
Risk/Reward:
1:1.5.
---
📝 CHART NOTE
SOL is showing improving short-term momentum, but the current price remains slightly below the illustrated LONG entry.
The important confirmation is whether buyers can reclaim 73.92 and sustain the upward movement.
Avoid treating an indicator signal or a single bullish candle as guaranteed continuation.
This is an educational chart framework, not a trade recommendation.
— @nayrbryanGaming
#SOLAnalysis #ChartSetup #PriceAction #TechnicalAnalysis #CryptoTrading #TradingIndicators #RiskManagement #DYOR #NFA
━━━━━━━━━━━